
Page 55 - MSc_thesis_R A Kil
P. 55
Permeability [D] 103
Parallel lamination
Massive calcarenite
Tabular cross-stratification
Trough cross-stratification
Bioturbation
Parallel lam. close to fracture
Faint lam. with bioclasts
102
101
0.4 0.45 0.5 0.55 0.6 0.65 0.7
Porosity [-]
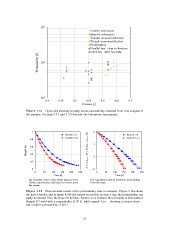
Figure 4.13 – Cross plot showing porosity versus permeability obtained from core analysis of
the samples. Sections 3.3.1 and 3.3.2 describe the laboratory experiments.
10
Height [m]
ln|h + Lc − H| − ln |h0 + Lc − H|Sample 2.3 Sample 2.3
Sample 5.1a Sample 5.1a
0.8
−1
0.6
0.4
−2
0.2
0 −3 50 100 150 200 250
0 50 100 150 200 250 0 Time [s]
Time [s]
(b) Logarithmic plot to determine permeability
(a) Example of the results of two typical perme- from the slope.
ability experiments, duplicated to reduce possi-
ble errors.
Figure 4.14 – Experimental results of the permeability tests on samples. Figure 4.14a shows
the direct results, and in figure 4.14b the results are plotted in such a way the permeability can
easily be derived from the slope of the lines. Section 3.3.2 explains the principles of this method.
Sample 2.3 yield with a permeability of 35 D, while sample 5.1a — showing a steeper slope —
has a higher permeability of 56 D.
37