
Page 16 - ndx_caldarelli
P. 16
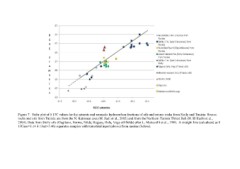
Figure 7. Sofer plot of δ 13C values for the saturate and aromatic hydrocarbon fractions of oils and source rocks from Sicily and Tunisia. Source
rocks and oils from Tunisia are from the N. Kairouan area (M. Sadi et al., 2002) and from the Northern Tunisia Thrust Belt (H. El Euchi et al.,
2004). Data from Sicily oils (Gagliano, Norma, Nilde, Ragusa, Gela, Vega oil fields) after L. Mattavelli et al., 1990. A straight line (calculated as δ
13Caro=1.14 δ 13sat+5.46) separates samples with terrestrial input (above) from marine (below).