
Page 43 - Dedola2011
P. 43
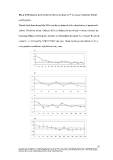
Fig. 4 ISSR dataset: spatial autocorrelation analyses of P. ferruginea based on Mantel
correlograms.
Dotted black lines bound the 95% confidence interval of the distribution of permuted r-
values.. Error bars about r indicate 95% confidence limits of each r-value estimated by
bootstrap. Mantel correlograms include: a) ali samples; b) cluster A; c) cluster B; and d)
cluster C, as retrieved by STRUCTURE analyses. Distance classes are plotted on the x-
axis; genetic correlation is plotted on the y-axis.

                     a

    h
01 ~------------------------------------------------~

  ç

        ('

02r-------------------------------------------------,

···!";' .j..~.·.·-...·.··

r.l~o---------------------------------------------------1

    d

- ... ........o~ro
....• •..  ·-·~···l·'··t·· --·~····""~~~·~·· ····"·ì~··· ~~T~i~.

·········
:: l~

O :0 40 100 M lOl 400 SOO 1.100 1<100 •:.lO ·?W l8 '4

                                                                                                              43

Gìan Luca Dedola: ANALISI DELLA VARIABILITÀ GENETICA DI PATELLA FéRRUGINEA, PATEL-LA ULl'SSIPONENSIS (MOLLUSCA: GASTROPODA) E PINNA
NOBILIS (MOLLUSCA: BIVALVIA): lLCONTRJBUTO DEl DATI MOLECOLARl ALLA CONSERVAZIONE DI SPECIE MINACCIATE - Tesi di douorato in Scienze
della natura e delle sue risorse • indiri7.zo BK>logi.a Ambientale, Università degli Studi di Sassarl