
Page 89 - Dedola2011
P. 89
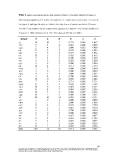
Table 2. Sample sizes and genetic diversity estimates obtained for the mitochondrial COI region of

Mediterranean populations of P. nobilis. N: sample sizes; S: number ofpolymorphic sites; H: number of
haplotypes; h: haplotype diversity; 1r: nucleotide diversity; d: mean of pairwise nucleotide differences.
Asterisks (*) and numbers identify samples whose sequences were taken from the GenBank database: ( l)
Katsares et al. 2008; (2) Ramboui et al. 2011. Populations are labelied as in T able l.

  Sample   N   s   H h 1t d

PC         18  lO  7   0.725   0.005  1.667
POR        3   3
LAZ        2   4   2   0.667   0.006  2.000
          21   9
os         11  6   2   1.000   0.012  4.000
           13  5
MO         5   3   8   0.829   0.006  1.886
           4   5
cc         5   6   6   0. 873  0.006  1.964
           10  8
SAL        5   7   5   0.705   0.005  1.615
MP         4
OTT        4   o   3   0.700   0.003  1.200
OR         5
MAR        18  5   3   0. 833  0.007  2.500
IMV        7   4
VMS        11  11  4   0.900   0.008  2.800
CP         10  5
MA         8   6   7   0.911   0.007  2.356
           15  6
svc        10  8   4   0.900   0.009  3.000
          20   7
MON        l   7   l   0.000   0.000  0.000
MLZ        2   10
PAC        9       4   1.000   0.008  2.833
OGN        9   o
ELB        5       3   0.700   0.005  1.800
           3    l
vz         7       lO  0. 895  0.007  2.242
           9   9
BIZ        7   2   4   0.714   0.005  1.714
CIPR       9   2
EP*1       17      6   0. 836  0.007  2.309
AG*1      287  o
Xl*1               5   0.867   0.007  2.533
KO*•           2
N*2            4   7   0.964   0.007  2.536
M*2            2
S*2             l  9   0. 886  0.007  2.362
8*2             l
K*2            42  6   0.889   0.008  2.822

TOT                lO  0. 895  0.006  2.184

                   l   0.000   0.000  0.000

                   2   1.000   0.003  1.000

                   6   0. 833  0.007  2.500

                   3   0.667   0.002  0.778

                   3   0.700   0.002  0.800

                   l   0.000   0.000  0.000

                   3   0.667   0.002  0.857

                   4   0.694   0.004  1.389

                   3   0.667   0.002  0.857

                   2   0.556   0.002  0.556

                   2   0. 382  0.001  0.382

                   58  0.911   0.007  2.543

                                                                                                            89

Gìan Luca Dedola: ANALISI DELLA VARIABILITÀ GENETICA DI PATELLA FéRRUGINEA. PATEL-LA ULl'SSIPONENSIS (MOLLUSCA: GASTROPODA) E PINNA
NOBILIS (MOLLUSCA: BIVALVIA): lLCONTRJBUTO DEl DATI MOLECOLARI ALLA CONSERVAZIONE DI SPECIE MINACCIATE · Tesi di douoralo in Scienze
della natura e delle sue risorse • indiri7.zo BK>logi.a Ambientale, Università degli Studi di Sassarl