
Page 3 - Gristina_Gagliano2004
P. 3
M. Gristina, M. Gagliano / Fisheries Research 67 (2004) 235–239 237
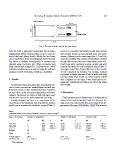
Water outflow
1,8 m 2,7 m
Plastic trap
Rush trap Water inflow
15 m
Fig. 2. Top view of a tank used in the experiments.
ANOVA with a replicated randomised block design Even if it is possible that lobsters could have entered
(Underwood, 1997). Treatment factors were: trap (two and escaped during an experimental trial, successive
levels) and tank (three levels). While the first factor counts of lobsters in the same traps after 4, 7 and 16 h
was considered as fixed and orthogonal, the factor tank make this unlikely. The number of individuals counted
was taken as random. Homogeneity of variance was in traps did not vary from one observation to the next.
checked using Cochran’s test. When necessary, data Catch rates were expressed as mean weight and were
were transformed using ln(X+1) (Underwood, 1997). found to be similar for rush and plastic traps (Table 1).
Statistical analyses were carried out using the software Trap type made little, if any, difference in the amount
package Gmav5 (University of Sidney, Australia). of bait consumed by lobsters. On average, lobsters
consumed a similar amount of bait in both rush traps
3. Results and the plastic traps (Table 1). When capture results
were combined for all traps, it was found that on av-
A restricted lobster size range was, specifically, cho- erage each individual was able to eat 3% of the initial
sen to avoid size and sex related biases in catch per- bait weight.
formance; hence, it was assumed that there would be
no size effect on the frequency distribution of lobster 4. Discussion
captures. Moreover, sex ratios of both trap types were
similar and close to the tank population sex ratio. Catch performance of lobster traps is influenced by
many factors such as material, mesh size, trap size, de-
Results showed that there is no significant differ- sign, soak time, bait and the life cycle stage of the tar-
ence between the traditional rush trap and the modern get species (Krouse, 1989; Miller, 1990). The selective
plastic one in number of individuals caught (Table 1).
Table 1
Statistical results of the catch performance of the two kinds of trapsa
Source of variation Number of individuals Weight of individuals Consumed bait
d.f. Ms F Ms F Ms F
Trap (Tr) 1 0.60 0.81 n.s. 30.96 2.54 n.s. 546.402 7.42 n.s.
Tank (Ta) 2 0.60 0.80 n.s. 13.18 1.69 n.s. 65.429 0.36 n.s.
Tr × Ta 2 0.74 0.99 n.s. 12.19 1.57 n.s. 73.664 1.16 n.s.
Residual 36 0.75 7.78 63.639
Total 41
Transformation None ln(X + 1) None
Cochran’s test C = 0.29 n.s. C = 0.24 n.s. C = 0.28 n.s.
a Not significant.