
Page 2 - Voda_Dapporto_alii_2016
P. 2
www.nature.com/scientificreports/
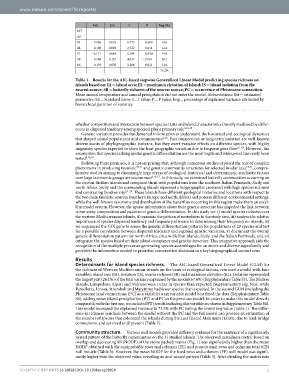
Est. S.E. t P lmg (%)
MT
AP
IA 0.069 0.039 1.775 0.088 14.0
EL 0.188 0.069 2.722 0.011 12.6
IS − 0.111 0.048 − 2.299 0.030 14.9
SR 0.588 0.127 4.637 < 0.001 20.1
PC 0.159 0.070 2.268 0.031 11.6
73.2%
Table 1. Results for the AIC-based stepwise Generalized Linear Model predicting species richness on
islands based on: IA = island area; EL = maximum elevation of island; IS = island isolation from the
nearest source; SR = butterfly richness of the nearest source; PC = occurrence of Pleistocene connection.
Mean annual temperature and annual precipitation did not enter the model. Abbreviations: Est = estimated
parameter; SE = Standard Error; t = t value; P = P value; lmg = percentage of explained variance attributed by
hierarchical partition of variance.
whether competition and interaction between species traits and island characteristics (mostly mediated by differ-
ences in dispersal tendency among species) play a primary role 3,10,15 .
Genetic variation provides fundamental information to understand the historical and ecological dynamics
that shaped island populations and communities 6,16 . Past connections or long-term isolation are well-known
determinants of phylogeographic patterns, but they exert variable effects on different species, with highly
migratory species expected to show the least geographic variation due to frequent gene flow 16–18 . However, the
assumption that species lacking spatial genetic differentiation are the most vagile and widespread has rarely been
tested 6,16,19 .
Following these premises, it is not surprising that, although numerous studies exposed the role of complex
phenomena in producing faunistic 20,21 and genetic community structures for selected insular taxa 19,22 , compre-
hensive studies aiming to disentangle large arrays of ecological-historical and deterministic-stochastic factors
over large taxonomic groups are uncommon 8,16,17 . In this study, we examined butterfly communities occurring on
the circum-Sicilian islands and compared them with populations from the southern Italian Peninsula, Sicily and
north Africa. Sicily and the surrounding islands represent a biogeographic crossroad with high species richness
and contrasting biodiversity 23–25 . These islands have different geological histories and locations with respect to
the two main faunistic sources (southern Europe and north Africa) and possess different environmental settings,
while the well-known taxonomy and distribution of the butterflies occurring in this region make them an excel-
lent model system. However, the sparse information about their genetic structure has impeded the link between
community composition and patterns of genetic differentiation. In this study we: i) model species richness over
the western Mediterranean islands, ii) examine the pattern of nestedness in the study area, iii) analyse the relative
importance of species dispersal tendency and frequency at source in determining their frequency on islands, iv)
we sequenced the COI gene to assess the genetic differentiation patterns for populations of 29 species and test
for a possible correlation between dispersal tendency and regional genetic variation, v) document the overall
genetic differentiation pattern for north Africa, circum-Sicilian islands, Sicily, and the Italian Peninsula, and vi)
categorize the species based on their island occupancy and genetic structure. This integrative approach aids the
recognition of the multiple processes generating species assemblages for an entire and diverse superfamily and
provides the information needed to prioritize conservation decisions in a key biogeographical contact zone.
Results
Determinants for island species richness. The AIC-based Generalized Linear Model (GLM) for
the richness of Western Mediterranean islands on the basis of ecological factors, returned a model with four
variables: island area (IA), isolation (IS), source richness (SR) and maximum elevation (EL). Isolation represented
the largest part (26.1%) of the total variance explained by the model (67.8%) (Supplementary Table S3). The Maltese
islands, Lampedusa, Lipari and Vulcano were richer in species than expected (Supplementary Fig. S1a), while
Pantelleria, Linosa, Stromboli and Marettimo had fewer species than expected. In the second GLM (including the
Pleistocene land connections (PC) as a variable) a six variable model best fitted the data (Supplementary Table
S4), adding mean island precipitation (PT) and PC to the previous model. In order to make this model directly
comparable with the first one, we excluded PT (results including this variable are shown in Supplementary Table S4).
This model increased the explained variance to 73.2% with PC having the lowest lmg value (Table 1). The differ-
ence in richness residuals between the model without the PC and the full model can provide an estimation of
the number of species that colonized the islands during the Last Glacial Maximum (LGM), due to land-bridge
connections, and survived until present (Table 2).
Community structure. Various null models provided different evidence for the existence of a significantly
nested pattern of the butterfly communities on the 11 studied islands. The observed nestedness metric based on
overlap and decreasing fill (NODF) of the entire packed matrix (Fig. 1) was significantly higher than the mean
NODF obtained with the equiprobable rows and columns (EE) and proportional rows and columns total (CE)
null models (Table 3). However, the mean NODF for the fixed rows and columns (FF) null model was signifi-
cantly higher than the observed value, revealing an anti-nested pattern (Table 3). After dividing the matrix into
Scientific RepoRts | 6:28828 | DOI: 10.1038/srep28828 2