
Page 2 - 36 Elevation of the last interglacial highstand in Sicily
P. 2
ARTICLE IN PRESS
4 F. Antonioli et al. / Quaternary International 145– 146 (2006) 3–18
orbital tuning of high-resolution deep-sea oxygen Antonioli et al., 2002). Sector 2 extends for more than
isotope stratigraphy. According to this stratigraphy, 250 km along the south coast where there is no evidence
the geochronological subunit MIS 5.5 occurred between of the MIS 5.5 highstand. Sector 3 shows MIS 5.5
Termination II (end of MIS 6) and the onset of MIS 5.4, features at around +15 m, and differs from Sectors 2
spanning 133–115 ka (Shackleton et al., 2003). During and 4 as it lies on the Hyblean portion of Sicily, and is
this last interglacial period the global sea level rose to a tectonically part of the African Plate. In northeastern
level higher than the modern sea level (Waelbroeck Sicily (Sector 4), MIS 5.5 features are all above +100 m,
et al., 2002; Siddal et al., 2003). Reconstructed sea-level and as high as +175 m on Mt. Etna volcano (north of
curves, however, vary according to the location as a Catania, Monaco et al., 2000). On the volcanoes of
result of isostatic changes related to ice-sheet loading Ustica Island and the Aeolian islands, the MIS 5.5
cycles, which can be on the order of several meters higstand is found uplifted between +30 and +115 m
(Lambeck and Chappell, 2001; Lambeck et al., 2002; (Hearty, 1986; Lucchi et al., 2004a, b). Lampedusa, the
Potter and Lambeck, 2004). Along the Italian coasts, the southern Italian island (on the African plate) contains
average level attained by the sea during the MIS 5.5 is fossil Strombus bubonius at about +3 m, and thus
inferred to be $+7 m (Lambeck et al., 2004). Elsewhere appears to be relatively stable (Segre, 1960).
within the western and central Mediterranean Sea, the
validity of sea level markers identified by previous Bordoni and Valensise (1998) compiled MIS 5.5
researchers and the role of tectonic processes is highstand data for Italian shorelines, reporting 15 sites
discussed by Ferranti et al. (this volume). in Sicily. In the present work we build on their work and
report a comprehensive review of published papers on
However, the range of available data on distribution highstand elevations at 36 sites in Sicily, with new findings
of MIS 5.5 elevations in Sicily is limited. Therefore this from Egadi, Ustica and Lampedusa Islands. We also
study assembles previous data, together with new present new age data for two important sites at Taormina
results, to provide a comprehensive survey of the last and Cefalu` (see Fig. 2 and sites 1 and 24 of Fig. 1).
interglacial highstand in Sicily. We aim to expand the
information available on studied sections, provide more 2. Regional geologic setting
data on elevations of uplifted surfaces, and obtain new
dates on a number of sections and marine fossils so that With respect to the MIS 5.5 history, Sicily is divided
the dataset becomes statistically reliable enough to into four sectors (Fig. 1), and the setting of each is
produce a model. The results are applied to comment briefly described in this section. In general terms, Sector
on tectonic controls of uplift in the late Quaternary. 1 shows good evidence of stability despite a complex
history. Sector 2 is problematic because of rock
In this paper, the coastline of Sicily is divided into preservation problems. However, both Sectors 1 and 2
four coastal sectors and islands (Fig. 1). In Sector 1, in are currently tectonically more stable than the east coast
western Sicily (and Egadi island), MIS 5.5 is recognized
by terraces and notches at +7 to 12 m (Malatesta, 1957;
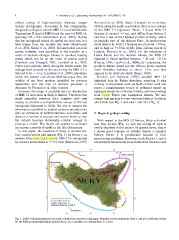
Fig. 1. DEM of Sicily showing how the coast is divided into sectors for this paper. Numbers are site numbers in Table 1, and are in different colours
for the different geomorphological quality factors. (A ¼ excellent, B ¼ intermediate, C ¼ low).