
Page 95 - MSc_thesis_R A Kil
P. 95
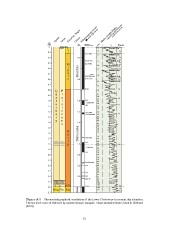
Figure A.5 – Chronostratigraphical correlation of the Lower Pleistocene to present day situation.
The sea level curve is reflected by marine isotope analysis. Chart modified from Cohen & Gibbard
(2010).

                                                             73