
Page 3 - 1991_Hutterer
P. 3
Variation and evolution of the Sicilian shrew 243
MP MH GR SR ER
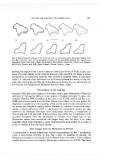
Fig. 2: Superimposed outlines of the external view of the fourth upper premolar (upper row)
and the posterior view of the condylar process of the mandible (below) for samples of
Crocidura sicula from (MP) Malta, Pleistocene, (MH) Malta, Holocene, (GR) Gozo, Recent,
(SR) Sicily, Recent, and (ER) Egadi Islands, Recent. Scale is l mm.
however, the angular from is more constant in the extant shrews of Sicily, Egadi, and
Gozo. The same applies to the condylar process of the mandible. Its shape is rather
characteristic in shrews (see Hutterer 1987; Molina & Hutterer 1989); in Crocidura
sicula it is relatively short and stout and differences between the examined popula-
tions only concern the size (Fig. 2). Other characters checked but not shown here do
not indicate any fundamental difference between them, either.
The problem of the long legs
Kotsakis (1986) described remains of Crocidura from Upper Pleistocene (Wtirmian)
sediments of Spinagallo, Sicily, as a new species, Crocidura esui (now C esuae, cor-
rected by Hutterer 1990, according to the rules of the ICZN), and he and Esu et al.
(1988) also referred fossils from the Ghar Dalam Cave, Malta, to the new species. Its
diagnostic character is a very long tibia, which led the author to the speculation that
the species was adapted to aquatic habits. However, in a review of anatomica! adap-
tations of shrews (Hutterer 1985) it was shown that semiaquatic species are only
known in the subfamily Soricinae, not Crocidurinae. Moreover, a comparison of
tibia length and skull size (Tab. l) demonstrates that within the 7 populations both
variables decreased from the Pleistocene to Present. The longer legs of the
Pleistocene shrews were associated with larger body size. As there is no other
character which would separate C esuae from Holocene populations of C sicula, I
prefer to include it into the latter species.
Size changes from the Pleistocene to Present
A comparison of several cranial and skeletal measurements of the 7 populations
shows a remarkable variation in size; fig. 3 gives an example. In generai, the
Pleistocene samples are the largest, and the Recent ones the smallest. There is always
overlap between a least two samples. Maximum reduction in size is 25 OJo. This trend