
Page 4 - 1991_Hutterer
P. 4
244 R. Hutterer
MB (mm) o D
D
6,5 D D
6
@o
o
oo
5,5
+
7,5 7.7 7,9 8 ,1 8,3 8,5 8;7 8,9 9 ,1 9 ,3 9,5 9,7
*+ Gozo R Malta H UTR (mm) X Egadi R O Slclly A
D Malta P
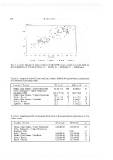
Fig. 3: A scatter diagram of upper toothrow length (UTR) versus maxillary breadth (MB) for
five populations of Crocidura sicula. R = Recent, H = Holocene, P = Pleistocene.
T ab l e l : Length of tibia (TL) and maxillary breadth (MB) in living and extinct populations
of Crocidura sicula (sensu lato).
Locality l Period TL ± sd n MB ± sd n
16.3± 0.6 200
Malta, Ghar Dalam l Early Pleistocene 6.6±0.2 51
Sicily, Spinagallo l Upper Pleistocene [15.1-17.6] 17
[Kotsakis 1986] 14.9 l [6.0 - 6.2] 3
Malta, Ghar Dalam l Upper Pleistocene 13.5± 0.5
Sicily l Recent 12.5± 0.8 20 6.1±0.2 24
Malta, Ghar Dalam l Neolithic 12.3 5 5.9±0 . 1 12
Gozo l Recent 12.3 2 5.8±0.1 27
Egadi Is . l Recent l 5.7±0.2 8
T ab l e 2 : Length and width of the upper third molar in living and extinct populations of Cro-
cidura sicula. ·
Locality l Period M 3 -Length M3-Width n
Malta, Ghar Dalam l Early Pleistocene 0.66 ± 0.06 1.30±0.05 10
Sicily, Spinagallo l Upper Pleistocene
[Kotsakis 1986] 0.60±0.04 [1.35] 2
Sicily l Recent 0.56±0.04 1.27 ± 0.08 13
Malta, Ghar Dalam l Neolithic 0 . 5 6 ± 0 .00 1.22±0.03 6
Gozo l Recent 0.52±0.03 1.25±0.05 7
Egadi l Recent 1.11±0.05 8