
Page 3 - Cubadda2001
P. 3
F. Cubadda et al. / Chemosphere 45 (2001) 561±569 563
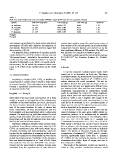
Table 1 WW/DW
Shell sizes, body weights and mean wet weight (WW)/dry weight (DW) ratio for the organisms analysed 1.27
1.27
Species Shell size range (cm) DW range (g) DW mean (g) 1.26
1.32
M. turbinata 1.0±3.0a 0.049±1.551 0.442
M. mutabilis 1.1±2.8a 0.055±1.081 0.351
P. caerulea 1.0±3.1b 0.050±0.808 0.228
P. lusitanica 1.1±3.0b 0.096±1.019 0.306
a Height.
b Length.
zinc analysis was performed by ¯ame atomic absorption standardized weights, using the overall mean value of
spectrometry (FAAS) with duplicate determination of body weight for the relevant species. In all cases multiple
each sample. Whenever low levels occurred, copper was comparisons between stations were carried out by the
determined by GFAAS. least signi®cant dierence (LSD) method. The LSD test
was used also for comparisons between species.
The detection limits, coecients of variation and the
results obtained for the BCR-certi®ed reference material Statistical analysis was performed using the package
278 (mussel tissue) ± included in the analytical runs to STATISTICAÓ for Windows (Release 4.5, StatSoft,
test the accuracy of the analytical method ± are reported 1993).
elsewhere (Campanella et al., 2001). As regards analyt-
ical accuracy, for all metals the measured values were 3. Results
equal to 91±106% of the certi®ed values in the CRM
used. In all the examined molluscs species metal levels
turned out to be dependent on body size. The linear
2.3. Statistical analysis correlation between log-transformed concentrations and
dry weights was highly signi®cant
P < 0:001 in all lo-
According to Boyden (1974, 1977), in shell®sh the cations whatever the metal considered. The test for
concentration of a given metal is related to body weight parallelism showed that generally the slopes of the re-
as a power function. This relationship can be linearized gression lines (b) were not signi®cantly dierent from
through a logarithmic transformation, which yields to one location to the other and thus mean values of log-
an equation of the form transformed concentrations at standardized weights
could be calculated by ANCOVA. These weight-ad-
log10Me a b log10 W ; justed means were then back-transformed and are re-
ported in Tables 2 and 3, together with ranges of the
where Me is the trace metal concentration, W is body original (untransformed) metal concentrations. In two
weight, a is equal to the logarithm of the multiplicative cases (Pb in M. turbinata, Cr in P. caerulea) equality of
coecient of the power function, and b (i.e., the slope of slopes was not met and the adjusted means were calcu-
the linear function obtained) coincides with the expo- lated as described in the previous section.
nent of the power function. In order to achieve this
linear relationship, all data (concentrations and dry From data in Tables 2 and 3 it is evident that the
body weights) were log-transformed prior to subsequent species belonging to the same genus exhibit similar ac-
analysis. The single log±log plots thus obtained for each cumulation patterns. In M. turbinata and M. mutabilis
species, metal and station were then examined for out- metal concentrations decrease in the following order:
lying values and the best ®t regression lines were calcu- Zn > Cu > Cd > Cr Pb, while in P. caerulea and
lated by the method of least squares. P. lusitanica the sequence is: Zn > Cd > Cu > Cr Pb.
With regard to the latter two metals it may be observed
Signi®cant dierences between metal concentrations that in stations 1±4 chromium concentrations match
in molluscs from dierent stations were tested by AN- those of lead, while in station 5 lead levels are de®nitely
COVA on transformed data with body weight log as higher. The species of the genus Patella are stronger
covariate. Normality and homoscedasticity, which are accumulators of cadmium (P < 0:001), with P. caerulea
required for the application of parametric methods, were reaching signi®cantly higher levels than P. lusitanica
checked and resulted to be substantially improved by the (P < 0:001). On the contrary, the species of the genus
double log transformation. Parallelism of the regression Monodonta show higher levels of copper and zinc in
lines was tested throughout at a P level of 0.05. When their tissues (P < 0:001).
this condition was not met ANCOVA was not per-
formed and the metal levels in dierent stations were The results of the regression analysis are reported in
calculated from the regression line of each station at Table 4. Only positive correlations between metal