
Page 5 - Cubadda2001
P. 5
F. Cubadda et al. / Chemosphere 45 (2001) 561±569 565
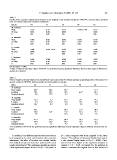
Table 4
Results of the regression analysis (concentrations vs dry weights) on log-transformed data by ANCOVA: common slopes, standard
error on common slopes and correlation coecientsa
Species Cd Cr Cu Pb Zn
M. turbinata 0.727 0.517 0.533 0.464±1.014b 0.253
Slope 0.055 0.055 0.030 0.026
SE slope 0.91 0.88 0.95 0.86
R
M. mutabilis 0.766 0.321 0.503 0.501 0.116
Slope 0.051 0.013 0.015 0.024 0.008
SE slope 0.89 0.95 0.97 0.94 0.87
R
P. caerulea 0.768 0.670±1.055b 0.796 0.965 0.589
Slope 0.046 0.051 0.057 0.026
SE slope 0.92 0.88 0.91 0.95
R
P. lusitanica 0.474 0.740 0.380 0.552 0.595
Slope 0.030 0.043 0.034 0.050 0.037
SE slope 0.95 0.96 0.93 0.92 0.96
R
a In all cases P < 0:001.
b Range of observed regression slopes: ANCOVA not performed because signi®cant dierences between these slopes at dierent lo-
cations were detected.
Table 5
Eect of location and body weight on the variability of trace metal content in molluscs expressed as percentage ratio of the total sum of
squares: results of ANCOVA with log-transformed body weight as covariate
Eect Cd Cr Cu Pb Zn
M. turbinata
Body weight 40.7 40.2 37.2 13.7
Location 50.5 40.6 58.5 n.d.a 81.3
Residuals (error) 8.8 19.2 4.3 5.0
M. mutabilis
Body weight 75.3 7.7 45.7 72.1 24.3
Location 5.9 91.4 51.4 19.1 67.9
Residuals (error) 18.7 0.9 2.8 8.8 7.9
P. caerulea
Body weight 42.1 69.5 11.9 24.9
Location 50.0 n.d.a 11.0 85.7 72.2
Residuals (error) 7.9 19.5 2.4 2.9
P. lusitanica
Body weight 41.4 61.6 60.4 18.7 43.9
Location 54.4 33.2 29.7 77.7 52.5
Residuals (error) 4.2 5.1 9.9 3.6 3.9
a Not determined: ANCOVA not performed because signi®cant dierences between regression slopes at dierent locations were de-
tected.
As molluscs from dierent stations were found not to (P < 0:05) compared with those sampled in the other
be homogeneous for their metal content after covariate stations. The molluscs of the genus Patella from station
adjustment, the eect of location was studied further 5 also showed higher levels of Pb (P < 0:001). Chro-
and multiple comparison tests were performed for each mium levels were higher in the organisms sampled in
couple species/metal. The organisms sampled in station stations 3±5 (P < 0:05). As regards Cu, the molluscs in
5 had signi®cantly higher levels of Cd (P < 0:01) and Zn station 5 contained the highest level of this metal, but