
Page 6 - HIMES_2007_
P. 6
606 A. H. Himes
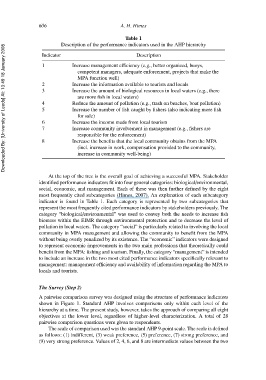
Table 1
Description of the performance indicators used in the AHP hierarchy
Downloaded By: [University of Leeds] At: 13:49 18 January 2008
Indicator Description
1 Increase management efficiency (e.g., better organized, buoys,
competent managers, adequate enforcement, projects that make the
MPA function well)
2 Increase the information available to tourists and locals
3 Increase the amount of biological resources in local waters (e.g., there
are more fish in local waters)
4 Reduce the amount of pollution (e.g., trash on beaches, boat pollution)
5 Increase the number of fish caught by fishers (also indicating more fish
for sale)
6 Increase the income made from local tourism
7 Increase community involvement in management (e.g., fishers are
responsible for the enforcement)
8 Increase the benefits that the local community obtains from the MPA
(incl. increase in work, compensation provided to the community,
increase in community well-being)
At the top of the tree is the overall goal of achieving a successful MPA. Stakeholder
identified performance indicators fit into four general categories: biological/environmental,
social, economic, and management. Each of these was then further defined by the eight
most frequently cited subcategories (Himes, 2007). An explanation of each subcategory
indicator is found in Table 1. Each category is represented by two subcategories that
represent the most frequently cited performance indicators by stakeholders previously. The
category “biological/environmental” was used to convey both the needs to increase fish
biomass within the EIMR through environmental protection and to decrease the level of
pollution in local waters. The category “social” is particularly related to involving the local
community in MPA management and allowing the community to benefit from the MPA
without being overly penalized by its existence. The “economic” indicators were designed
to represent economic improvements in the two main professions that theoretically could
benefit from the MPA: fishing and tourism. Finally, the category “management” is intended
to include an increase in the two most cited performance indicators specifically relevant to
management: management efficiency and availability of information regarding the MPA to
locals and tourists.
The Survey (Step 2)
A pairwise comparison survey was designed using the structure of performance indicators
shown in Figure 1. Standard AHP involves comparisons only within each level of the
hierarchy at a time. The present study, however, takes the approach of comparing all eight
objectives at the lower level, regardless of higher-level characterization. A total of 28
pairwise comparison questions were given to respondents.
The scale of comparison used was the standard AHP 9-point scale. The scale is defined
as follows: (1) indifferent, (3) weak preference, (5) preference, (7) strong preference, and
(9) very strong preference. Values of 2, 4, 6, and 8 are intermediate values between the two