
Page 16 - HimesAH(2007)
P. 16
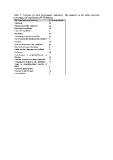
Table  4.  Priorities  for  MPA  performance  indicators.  The  numbers  in  the  table  represent
percentages of respondents (N=50 fishers).

MPA performance indicator                    % of respondents

Planning                                     80

Management better organised                  66
More strict regulations                      30
Less strict regulations                      6

Processes                                    24

Community involved or benefits               22

Use of sustainable development principles  2

Outputs                                      54

Increase enforcement and compliance          48
More and accurate information                6
Better services, signage, port, facilities   2

Outcomes                                     58

Environment  is  protected/Increase  in      26
biomass                                      12
Tourism increases or is better organised     12
Community is helped to cope with MPA
Begin  to  value/understand  benefits  of    4
MPA                                          2
Economic development                         16
Increase in fisher's catch                   6

Less pollution 