Page 20 - HimesAH(2007)
P. 20

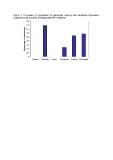
Figure  3.  Percentage  of  respondents  by  stakeholder  category  that  identified  performance 
indicators in the six areas of management (N=50 fishers). 

                     0.9 

                           0.8 

Percentage of respondents  0.7 

                           0.6 

                           0.5 

                           0.4 

                           0.3 

                           0.2 

                           0.1 

                           0                         Input  Processes  Outputs  Outcomes 
                                 Context  Planning 
   15   16   17   18   19   20   21   22