
Page 2 - MICHAUX2002
P. 2
428 J.R. Michaux et al.
role in insular differentiation. However, recent genetic studies data). Data on body size were obtained from Michaux
(Michaux et al., 1996b) have shown that this is not always (1996). Mean body mass of continental populations is
the case and that ecological factors such as the lower number approximately 23 g (25 g on Iberian peninsula and 23 g for
of competitors or predators may be more important. This Italy). In several islands the mean body mass is more than
hypothesis is corroborated by other studies (Van Valen, 1973; 30 g: Mallorca (35 g), Ibiza (29 g) and Marettimo (30 g)
Case, 1978; Lomolino, 1985; Angerbjörn, 1986). In addition, (Fig. 1).
several authors (Carlquist, 1974; Case, 1978; Heaney, 1978;
Wassersug et al., 1979; Sarà & Casamento, 1995) have Competitor and predator species account
shown that the area size of the island and the degree of
isolation of the population from sources of immigrants could We used published data from European and national atlases
also have an important impact on the occurrence of the or check-lists, to obtain the numbers of competitor and
insular syndrome. This last factor can be estimated by a predator species present in the studied areas (Arnold &
measure of genetic isolation, i.e. gene flow. Burton, 1978; Schilling et al., 1986; Lo Valvo et al., 1993;
Meschini & Frugis, 1993; Yeatman-Berthelot & Jarry, 1994;
Our aim is to test the relative contribution of three factors: Michaux et al., 1996b; Hagemeijer & Blair, 1997; Sarà,
the area size of the island, the number of species of com- 1998; Mitchell-Jones et al., 1999). Quantitative data of preda-
petitors, and the number of species of predators, to changes tion on A. sylvaticus were checked in synopses and reviews
in body size of the woodmouse (Apodemus sylvaticus) in the dealing with the food habits of the European fauna. The main
Western Mediterranean Sea. We used the independent references were: Cramp & Simmons, 1977–1993, Mikkola
contrasts method in order to take into account the genetic (1983), Hancock & Kushlan (1984), Gensbøl (1992),
distances among populations. Meyburg et al. (1998). Only breeding birds and not recently
introduced mammals (i.e. Callosciurus, Tamias) were considered.
MATERIALS AND METHODS Some very rare (e.g. Pica pica in Sardinia or Hieraaetus
fasciatus in Calabria) or marginal (e.g. Microtus savii in
Data on woodmouse populations South-eastern France) distributions were not listed. The
resulting list of species, interacting as competitors or
Genetic distances between populations were obtained from predators with the wood mouse, is reported in Table 2.
Michaux et al. (1996a,b, 1998a,b) (Table 1). Geographic
distances among all pairs of islands and peninsulas were Statistical analyses
obtained from maps (Fig. 1a).
Mantel test between geographical distances and
Island populations of woodmice have been considered as genetic distances
giant forms on the basis of cranial morphometric analyses
(Michaux, 1996; Michaux et al., 1996b) and of classical Two variables, geographical distance and genetic distance
morphological data (Felten & Storch, 1970; Kahmann & between pairs of A. sylvaticus populations were in the form of
Niethammer, 1971; Sans-Coma & Kahmann, 1977; Alcover
& Gozalbez, 1988; Libois & Fons, 1990; Libois, unpublished
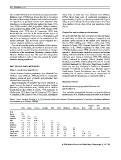
Table 1 Genetic distances (%) (Nei & Li, 1979) between insular and continental European populations of woodmice (Apodemus sylvaticus).
From Michaux et al. (1996a,b, 1998a,b)
Porque- Port
Italy Spain Corsica Sardinia Elba Sicily Mallorca Menorca Ibiza rolles Cros Maretimo
Italy —
Spain 2.6 —
Corsica 1.37 2.7 —
1.27
Sardinia 1.49 2.45 0.84 —
3.3 1
Elba 0 2.6 2.7 3.5 —
2.3 2.6 3.7 —
Sicily 3.7 2.9 2.3 2.4 2.5 2.9
2.5 2.5 2.3 2.7
Mallorca 2.6 1.3 2.7 2.6 2.3 2.8 —
2.93 2.7 2.6 2.7 0.5
Menorca 2.3 1.2 2.91 2.6 2.5 0.65 —
3.7 0 1.3 0.3
Ibiza 2.3 1.1 1.4 1.3 —
2.9 1.5 1.1 —
Porquerolles 2.6 1.1 2.8 1.45 1.4
2.8 2.9
Port Cros 2.6 1.47 —
2.9 —
Marettimo 3.7 2.9
© 2002 Blackwell Science Ltd, Global Ecology & Biogeography, 11, 427– 436