Page 3 - MICHAUX2002
P. 3

Body size increase in insular rodent populations 429

(a)                                                                       13

           100 km                                                               23

                                                                          28        11

                                                                          19 10         28    25

                                                                                           5

                   26 2                31                                                     31

                         35 9 7                                            29 27

                                                                          8

                                                                                    4

                                                                                    25

                                                                                          12      28 6

                                                                                        30

                          Sicilia (6)

(b) Marettimo (12)

                                                                             Port-Cros (11)
                                                                          Ibiza (9)
                                                                           Menorca (8)

                                                                              Mallorca (7)

                                                                          Spain (2)
                                                                           Porquerolles (10)
                                                                            France (13)

                                                                       Sardinia (4)

                                                                        Corsica (3)
                   0.01

                                                                        Italy (1)

                                                                                                                           Elba (5)

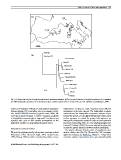
Fig. 1 (a) Geographic origins of sampled populations of Apodemus sylvaticus. (b) Tree of genetic distances of sampled populations of A. sylvaticus
(see Table 2) (numbers in circles refer to location on maps, numbers in italic refer to average body size of A. sylvaticus, from Michaux, 1996).

matrices. Permutation methods are used widely in population               independence of data (i.e. traits measured across different
biology (Manly, 1991) and allow one to investigate correla-               populations of the same species). The independent contrasts
tion between distance matrices (Legendre et al., 1994). We                method is used for interspecific comparative analyses. Popu-
used the program Permute 3.4 (by P. Casgrain, available                   lations, like species, are also linked by historical events and it
at htpp://alize.ere.umontreal.ca/∼casgrain/). Correlation was             is then necessary to control for genetic information in an
repeated after each of 999 random permutations of the                     intraspecific comparative analysis in order to avoid potential
dependent variable (i.e. geographical distance) matrix.                   historical confounding effects (i.e. here phylogeography) (see
                                                                          Garland & Adolph, 1994). This can be achieved by taking into
Independent contrasts method                                              account the genetic distances between studied populations.

We used the phylogenetically independent contrasts method                    The genetic distances between pairs of populations were
(Felsenstein, 1985; Harvey & Pagel, 1991; Garland et al.,                 used to obtain a tree (Fig. 1b). We used the CAIC computer
1992; Harvey, 1996) in order to resolve the problem of non-               application (Purvis & Rambaut, 1995) for independent
                                                                          contrasts analyses. Quantitative data were logarithmically

© 2002 Blackwell Science Ltd, Global Ecology & Biogeography, 11, 427–436
   1   2   3   4   5   6   7   8