
Page 3 - MICHAUXetal1998
P. 3
Hereditas 129 (1998) mtDNA variabilitv of Iberian wood mouse (Apodemus sylvaticus) 189
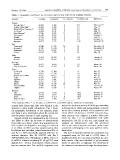
Table 1. Geographic coordinates (in centesimal degrees) and codes of the trapping localities
Locality Latitude Longitude No. animals Locality code Date M/Y
France 42.495 3.129 6 F2 February 93
Banyuls/Mer* 42.432 3.100 8 F3 May 93
Argeles (Massane)* 43.505 6.809 4 F4 May 94
Esterel (Mont Vinaigre)* 43.894 6.941 2 F5 May 94
La Penne* 47.266 4.094 F6 April 94
Saint Brisson* 46.500 -0.046 11 F7 October 93
Menigoute* 42.765 0.203 F8 June 95
Fabian 42.579 2.029 2 F9 October 95
Bouillouses 44.372 3.533 4 FIO February 96
Ispagnac 2
2
Italy 42.260 1 1.745 26 I1 December 92
Tarquinia* 42.880 1 1.090 2 I2 December 92
Grosseto* 38.135 15.867 4 I5 January 94
Gambarie* 44.345 7.500 1 I6 May 94
Cuneo*
Sicily 37.919 14.400 3 Si 1 January 94
Ficuzza 37.951 13.356 3 Si2 January 94
Grateri
Portugal 38.575 - 8.650 1 PI March 96
Setubal 38.959 -9.265 3 P2 March 96
Vale de Guarda
Spain 42.784 - 7.100 2 s1 May 95
As Nogais 43.635 -7.350 2 s2
43.257 -4.852 12 s3 May 95
Viveiro 42.676 2 s4
42.270 0.182 7 s5 May 95
Posada de Valdeon 42.351 2.981 2 S6 May 95
Torla 38.703 3.127 20 s7 April 94
37.081 -0.458 1
Figueras 39.473 -6.49 1 S8 April 94
LlanCa -5.828 3 s9 May 95
Alcoy
Cot0 Doiiana January 96
Trujillo March 96
Baleares 39.788 2.870 3 Ma1 October 97
Lluc
Alamedra 39.729 2.818 6 Ma2 October 97
Alaior
Ibiza (3 sites) 39.958 4.154 4 Me 1 October 97
38.941 1.290 10 Ibl May 96
* The localities with an * are the same as in MICHAUXet al. (1996) and are numbered in accordance.
animals from France and Italy were included in the isolated by electrophoresis on 4% PAA gels according
analyses to allow useful comparisons. Fig. 1 shows to TEGELSTRO(M1986) and polymorphism visualised
the geographic distribution of the sampling points by the silver staining protocol of GUILLEMETaTnEd
and Table 1 gives information about the sample size LEWIS(1983). All distinctive mtDNA restriction frag-
and the precise location of each trapping site. ment patterns were assigned a number when pro-
Trapped animals were maintained in the laboratory duced by Rsa I or an alphabetical code when
and killed to allow the isolation of mitochondrias produced by Hue 111. In this way, each animal was
from fresh tissue (heart, spleen, liver and kidneys) by assigned an alphanumeric code. All specimens
differentiated centrifugations, according to LANSMAN sharing the same composite restriction pattern were
et al. (1981). mtDNA was then isolated and purified considered as belonging to the same mtDNA matri-
by alkaline lysis and ether-phenol extraction (PALVA lineal clone.
and PALVA1985) and finally digested with two re- The level of similarity between two individuals was
striction enzymes: Hue I11 (GGCC) and Rsa I computed using the NEI and Lr (1979) index. A
(GTAC) (Boehringer-Mannheim or BRL). One to 3 neighbour-joining tree was constructed from the simi-
p1 mtDNA solution containing 20-40 ng DNA were larity matrix using one individual of yellow-necked
digested for 1-2 h in a 10 pl reaction volume contain- mouse ( A . Javicollis) as outgroup. The robustness of
ing one enzyme unit. The mtDNA fragments were the inferences was assessed through bootstrap analy-