Page 6 - Matthias_Stöck_&_c_2013
P. 6

Page 7 of 19 (page number not for citation purposes)
                                 http://www.biomedcentral.com/1471-2148/8/56


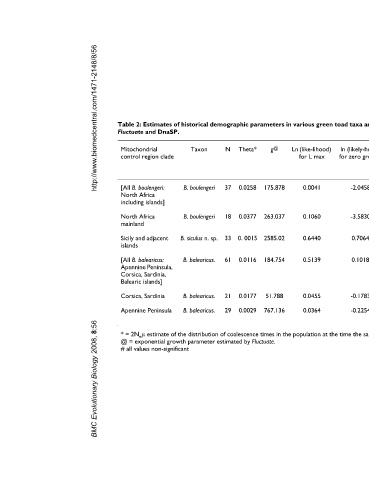
                                        Table 2: Estimates of historical demographic parameters in various green toad taxa and groups from mtDNA control region analyses using parameter estimation in the programs
                                        Fluctuate and DnaSP.

                                         Mitochondrial          Taxon       N   Theta*     g @   Ln (like-lihood)   ln (likely-hood)   2(L max - L = 0)  No growth can   MinAge estimate for   MinAge estimate   Tajima's D #
                                                                                                                                         g
                                         control region clade                                       for L max    for zero growth                  be rejected   corrected rate (pi-Net)  for non-corrected
                                                                                                                                                                                         rate (pi-betw.)


                                         [All B. boulengeri:   B. boulengeri  37  0.0258  175.878    0.0041          -2.0458         4.0998          Yes               1.6 My               0.9 My         -0.66664
                                         North Africa
                                         including islands]

                                         North Africa         B. boulengeri  18  0.0377  263.037     0.1060          -3.5830         7.378           Yes               2.2 My               1.4 My         -1.63869
                                         mainland

                                         Sicily and adjacent   B. siculus n. sp.  33  0. 0015  2585.02  0.6440       0.7064         -0.1248          No                  NA                  NA            0.74861
                                         islands

                                         [All B. balearicus:   B. balearicus.  61  0.0116  184.754   0.5139          0.1018          0.8242          No                  NA                  NA            0.74773
                                         Apennine Peninsula,
                                         Corsica, Sardinia,
                                         Balearic islands]

                                         Corsica, Sardinia    B. balearicus.  21  0.0177  51.788     0.0455          -0.1783         -0.447          No                  NA                  NA            -0.07834

                                         Apennine Peninsula   B. balearicus.  29  0.0029  767.136    0.0364          -0.2254         0.5236          No                  NA                  NA            0.19720
                                 BMC Evolutionary Biology 2008, 8:56
                                         * = 2N µ estimate of the distribution of coalescence times in the population at the time the sample was taken, estimated by Fluctuate
                                               e
                                         @ = exponential growth parameter estimated by Fluctuate.
                                         # all values non-significant
   1   2   3   4   5   6   7   8   9   10   11