
Page 9 - Matthias_Stöck_&_c_2013
P. 9
BMC Evolutionary Biology 2008, 8:56 http://www.biomedcentral.com/1471-2148/8/56
Mismatch distributions from 541 bp of the mtDNA control region
Figure 3
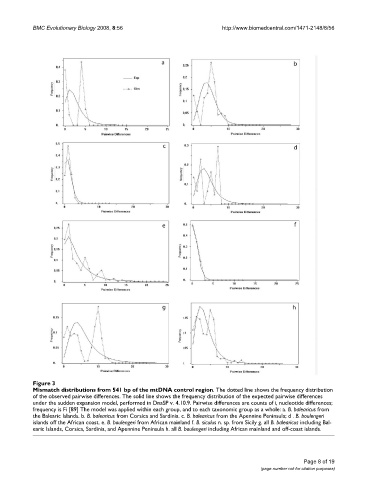
Mismatch distributions from 541 bp of the mtDNA control region. The dotted line shows the frequency distribution
of the observed pairwise differences. The solid line shows the frequency distribution of the expected pairwise differences
under the sudden expansion model, performed in DnaSP v. 4.10.9. Pairwise differences are counts of i, nucleotide differences;
frequency is Fi [89] The model was applied within each group, and to each taxonomic group as a whole: a. B. balearicus from
the Balearic Islands. b. B. balearicus from Corsica and Sardinia. c. B. balearicus from the Apennine Peninsula; d . B. boulengeri
islands off the African coast. e. B. boulengeri from African mainland f. B. siculus n. sp. from Sicily g. all B. balearicus including Bal-
earic Islands, Corsica, Sardinia, and Apennine Peninsula h. all B. boulengeri including African mainland and off-coast islands.
Page 8 of 19
(page number not for citation purposes)