Page 2 - Mullus1991
P. 2

720                               M. CAMMARATA et al.
                                           Tablc  l. Allclic frequencics  relative  to thc  analyzed loci  and their  R, values
                                                                             Allclic frequencies
                                                          Tissue  with         M.b.   M.s.
                                       Enzymes   Locus   best aclivity   R,   No.  70   65
                                        MDH     MD Hl   H,  L,  E,  M, G   0.26   l
                                                MDH2         L       0.33       l      l
                                                MDHJ        H        0.18       o      0.138
                                       LDH      LDHI      H,  L,  M,  E   0.12   l     l
                                                LDH1      H,  F, M   0.21       l      l
                                                LDH3         E       0.59       l      l
                                       ADH      AD Hl        L       0.12       0.028   o
                                                ADH1         L       0.14       0.972   l
                                                ADH2         L       0.26       0.028   o
                                                ADH3         L       0.16       0.028   o
                                                ADH4         L       0.19       l      l
                                                ADHS         L       0.33       l      l
                                                ADH6         L       0.35       0.286   o
                                       GPD      GPD1         L       0.14       l      l
                                                GPD1       L, H,  E   0.19      l
                                       SOD      SODI         L       0.29       l      l
                                                SOD1       H,L,G     0.41       o      l
                                                SOD2       H,L,G     0.53       l      o
                                       IDH      IDHl         L       0.18       l      l
                                                IDH1         L       0.27       1      l
                                       SDH      SDHl         L       0.28       1      l
                                                SDH2         L       0.3        l      l
                                                       l- 0.934  D =0.068
                                        Generai protein
                                         PMM    PMMI        M        0.31       l
                                                PMM2        M        0.47       0.128
                                                PMM3        M        0.61       l


                         Ali  the  above  enzyme  stammg  solutions  were  then   Genera/ proteins
                        incubated with gel slabs at 37"C unti! the appropriate bands
                        were visualized; staìnìng of the gels was stopped by rinsìng   Analysis of generai proteins from liver,  heart and
                        with  water,  and  adding  preservative  solution  (7%  acetic   eye  has  revealed  such  a  high  variance  in  the  indi-
                        acid).  Ali  the products were  purchased from  Sigma.   viduai patterns as to not be considered taxonomically
                                                                   significant.
                                                                     Generai protein analysis results far the muscle are
                                         RESULTS                   characterized by the presence of the A and C (Fig. 2)
                        Isoenzymatic analysis                      areas which were abundant in labile bands and differ-
                          The  seven  enzymatic systems  investigated for  the
                        two species codify for the following 20 loci:  MDH!,
                        MDH2,  MDH3,  LDHI,  LDH2,  LDH3,  ADHI,               LDH              SOD
                        ADH2,  ADH3,  ADH4,  ADH5,  ADH6,  ct.GPD l ,     a                    b
                        ct.GPD2,  SOD l,  SOD2,  !D Hl,  IDH2,  SDHl,
                        SDH2.                                        1~          w
                          The allelic frequencies relative to the analyzed loci   2~
                        and their Rr are shown in Table l. There is increased
                        enzymatic activity in  the organs considered.
                          In ali samples, l4loci appeared to be monomorphic   ~
                        far  the  same  allele  (i.e.  MDHl,  MDH2,  LDHI,
                        LDH2,  LDH3,  ADH4,  ADH5,  ct.GPDl,  ct.GPD2,                                 +-1
                        SOD l,  JDH!,  JDH2,  SDHI,  SDH2)  and  had
                        identica! patterns in  the  two  species  under study.                         }
                          The presence of MDH3 was limited ton. 9 (13.8%)
                        of Mullus  surmuletus individuals, whereas in Mullus
                        barbatus ADHI, ADH3 and ADH6 were found in n. 2   : l'   -
                        (2.8%), n. 2 (2.8%),  and n. 20  (28.6%) of the speci-  3~ ·.
                        mens, respectively. In n. 2 (2.8%) of Mullus barbatus,                ;.
                        the  ADH2 locus  presented  an  allelic  variation.
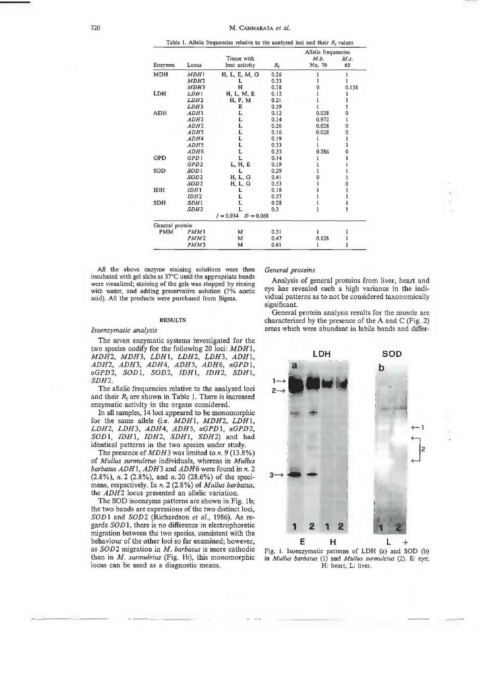
                          The SOD isoenzyme pattems are shown in Fig.  l b;
                        the two bands are expressions of the two distinct loci,
                        SOD l  and  SOD2  (Richardson et  al.,  1986).  As re-
                        gards SO D l, there is no difference in electrophoretic   1  2  1  2 :
                        migration between the two species, consistent with the
                        behaviour ofthe other Joci so far examined; however,   E   H             l   +
                        as  SOD2 migration in  M. barbatus is  more cathodic   Fig.  l.  Isoenzymatic  patterns  of  LDH  (a)  and  SOD  (b)
                        than in  M.  surmuletus  (Fig.  lb),  this  monomorphic   in  Mullus  barbatus  (l)  and Mullus  surmuletus  (2).  E: eye;
                        locus can  be used  as a  diagnostic means.              H: heart;  L: liver.
   1   2   3   4