
Page 4 - Reale_2006
P. 4
176 A. Reale et al.
ago. The bottom longline is used very often (63%), because in the MPA the sea bottom is
rich with Posidonia oceanica, and there are areas of rocky substratum that are conducive for
this activity.
Considering these local traditional gears, the species Scorpaena porcus, Scorpaena scrofa,
Palinurus elephas, and Sepia officinalis were found to be the most representative and with the
greatest commercial value.
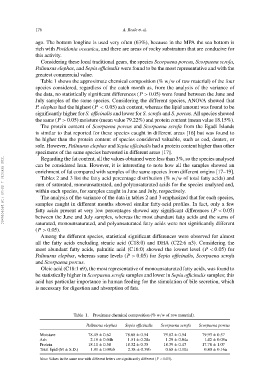
Table 1 shows the approximate chemical composition (% w/w of raw material) of the four
species considered, regardless of the catch month as, from the analysis of the variance of
the data, no statistically significant differences (P> 0.05) were found between the June and
July samples of the same species. Considering the different species, ANOVA showed that
P. elephas had the highest (P< 0.05) ash content, whereas the lipid amount was found to be
significantly higher for S. officinalis and lower for S. scrofa and S. porcus. All species showed
the same (P> 0.05) moisture (mean value 79.22%) and protein content (mean value 18.15%).
The protein content of Scorpaena porcus and Scorpaena scrofa from the Egadi Islands
is similar to that reported for these species caught in different areas [16] but was found to
be higher than the protein content of species considered valuable, such as cod, dentex, or
sole. However, Palinurus elephas and Sepia officinalis had a protein content higher than other
specimens of the same species harvested in different areas [17].
Downloaded At: 20:22 7 January 2011 enrichment of fat compared with samples of the same species from different origins [17–19].
Regarding the fat content, all the values obtained were less than 3%, so the species analysed
can be considered lean. However, it is interesting to note how all the samples showed an
Tables 2 and 3 list the fatty acid percentage distribution (% w/w of total fatty acids) and
sum of saturated, monounsaturated, and polyunsaturated acids for the species analysed and,
within each species, for samples caught in June and July, respectively.
The analysis of the variance of the data in tables 2 and 3 emphasized that for each species,
samples caught in different months showed similar fatty-acid profiles. In fact, only a few
fatty acids present at very low percentages showed any significant differences (P< 0.05)
between the June and July samples, whereas the most abundant fatty acids and the sums of
saturated, monounsaturated, and polyunsaturated fatty acids were not significantly different
(P> 0.05).
Among the different species, statistical significant differences were observed for almost
all the fatty acids excluding stearic acid (C18:0) and DHA (C22:6 n3). Considering the
most abundant fatty acids, palmitic acid (C16:0) showed the lowest level (P< 0.05) for
Palinurus elephas, whereas same levels (P> 0.05) for Sepia officinalis, Scorpaena scrofa
and Scorpaena porcus.
Oleic acid (C18:1 n9), the most representative of monounsaturated fatty acids, was found to
be statistically higher in Scorpaena scrofa samples and lower in Sepia officinalis samples; this
acid has particular importance in human feeding for the stimulation of bile secretion, which
is necessary for digestion and absorption of fats.
Table 1. Proximate chemical composition (% w/w of row material).
Palinurus elephas Sepia officinalis Scorpaena scrofa Scorpaena porcus
Moisture 78.45 ± 0.62 78.68 ± 0.54 79.82 ± 0.54 79.93 ± 0.57
Ash 2.18 ± 0.04b 1.51 ± 0.28a 1.29 ± 0.04a 1.42 ± 0.09a
Protein 18.11 ± 0.58 18.32 ± 0.35 18.39 ± 0.47 17.78 ± 1.07
Total lipid (M ± S.D.) 1.91 ± 0.09ab 2.38 ± 0.39b 0.68 ± 0.10a 0.80 ± 0.16a
Note: Values in the same row with different letters are significantly different (P< 0.05).