
Page 7 - Tomasello_Borra_etal2009
P. 7
Seagrass meadows at the extreme of environmental tolerance Tomasello, Di Maida, Calvo, Pirrotta, Borra & Procaccini
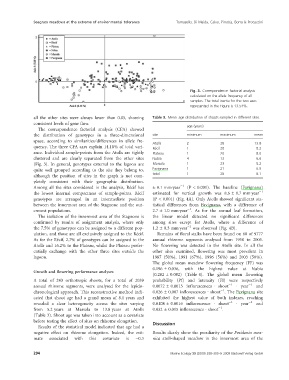
Fig. 3. Correspondence factorial analysis
calculated on the allele frequency of all
samples. The total inertia for the two axes
represented in the Figure is 13.54%.
all the other sites were always lower than 0.05, showing Table 3. Mean age distribution of shoots sampled in different sites.
consistent levels of gene flow.
age (years)
The correspondence factorial analysis (CFA) showed
the distribution of genotypes in a three-dimensional site minimum maximum mean
space, according to similarities ⁄ differences in allele fre-
quency. The three CFA axes explain 14.18% of total vari- Atolls 2 28 13.8
ance. Individual sample-points from the Atolls are tightly Re´ cif 1 20 8.2
clustered and are clearly separated from the other sites Plateau 1 20 8.0
(Fig. 3). In general, genotypes external to the lagoon are Nubia 4 13 6.6
quite well grouped according to the site they belong to, Marsala 1 23 5.2
although the position of sites in the graph is not com- Favignana 1 21 6.5
pletely consistent with their geographic distribution. total 1 28 8.1
Among all the sites considered in the analysis, Re´cif has
the lowest internal compactness of sample-points. Re´cif ± 0.1 mmÆyear)1 (P < 0.001). The baseline (Favignana)
genotypes are arranged in an intermediate position estimated for vertical growth was 8.6 ± 0.7 mmÆyear)1
between the innermost area of the Stagnone and the out-
ermost populations. (P < 0.001) (Fig. 4A). Only Atolls showed significant sta-
The isolation of the innermost area of the Stagnone is tistical differences from Favignana, with a difference of
confirmed by results of assignment analysis, where only 2.7 ± 1.0 mmÆyear)1. As for the annual leaf formation,
the 7.5% of genotypes can be assigned to a different pop-
ulation, and those are all exclusively assigned to the Re´cif. the linear model detected no significant differences
As for the Re´cif, 2.7% of genotypes can be assigned to the
Atolls and 16.2% to the Plateau, whilst the Plateau prefer- among sites except for Atolls, where a difference of
entially exchange with the other three sites outside the 1.2 ± 0.3 mmÆyear)1 was observed (Fig. 4B).
lagoon.
Remains of floral stalks have been found on 68 of 9777
Growth and flowering performance analyses
annual rhizome segments analysed from 1950 to 2005.
A total of 243 orthotropic shoots, for a total of 2039
annual rhizome segments, were analysed for the lepido- No flowering was detected in the Atolls site. In all the
chronological approach. This reconstructive method indi-
cated that shoot age had a grand mean of 8.1 years and other sites examined, flowering was most prevalent in
revealed a clear heterogeneity across the sites varying
from 5.2 years at Marsala to 13.8 years at Atolls 1987 (50%), 1991 (67%), 1996 (56%) and 2003 (50%).
(Table 3). Shoot age was taken into account as a covariate
before testing the effect of sites on rhizome elongation. The global mean meadow flowering frequency (FF) was
Results of the statistical model indicated that age had a 0.196 ± 0.036, with the highest value at Nubia
negative effect on rhizome elongation. Indeed, the esti-
mate associated with this covariate is )0.3 (0.282 ± 0.082) (Table 4). The global mean flowering
probability (Pf) and intensity (FI) were respectively
0.0072 ± 0.0015 inflorescences Æ shoot)1 Æ year)1 and
0.026 ± 0.007 inflorescences Æ shoot)1. The Favignana site
exhibited the highest value of both indexes, reaching
0.0108 ± 0.0016 inflorescence Æ shoot)1 Æ year)1 and
0.032 ± 0.015 inflorescence Æ shoot)1.
Discussion
Results clearly show the peculiarity of the Posidonia ocea-
nica atoll-shaped meadow in the innermost area of the
294 Marine Ecology 30 (2009) 288–300 ª 2009 Blackwell Verlag GmbH