
Page 6 - capula_eal2009
P. 6
222 MASSIMO CAPULA, SARA CHIANTINI, LUCA LUISELLI, ANNA LOY
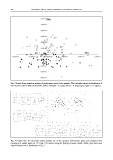
Fig. 3 Results from ordination analysis of partial warp scores for the samples. The scatterplot shows the distribution of
the first two Relative Warp scores (RW1, RW2). Triangles = P. sicula; circles = P. wagleriana; squares = P. raffonei.
Fig. 4 Results from the canonical variate analysis run on the samples. Deformation grids were produced from
regression of partial warps on CV1 and CV2 scores, using the tpsRegr program (Rohlf, 2006); grids have been
magnified three times. Symbols as in fig. 3.