
Page 8 - capula_eal2009
P. 8
224 MASSIMO CAPULA, SARA CHIANTINI, LUCA LUISELLI, ANNA LOY
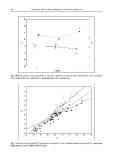
Fig. 6 Whiskers plot for mean and confidence intervals (± 0.95) of centroid size (CS; solid line) and snout-vent length
(SVL; dashed line) for P. sicula (S), P. wagleriana (W), and P. raffonei (R).
Fig. 7 Variation of head length (HL) and snout-vent length (SVL) in Podarcis sicula (empty rhombi), P. wagleriana
(filled squares), and P. raffonei (filled circles).