
Page 14 - climate-change2013
P. 14
Temperature and salinity are expected to increase At this stage there are no widely accepted scenarios for
throughout the whole water column, that is, in the up- the longer-term regional distribution of projected sea-
per, intermediate and deep layers. Sea-surface temper- level rise in the Mediterranean. Sea-level for a particular
atures are expected to be approximately 2.5°C higher region might be quite different from the global mean.
by 2100. As a consequence of this general warming, The contributions of ice melt and local factors such as
deep-water formation and the ventilation (oxygenation) local tectonic movements or storm surge together with
of deep basins could be reduced. The thermohaline temperature and salinity changes will affect the rise in
circulation of the Mediterranean, with Atlantic waters sea levels around the Mediterranean coastline, from
entering through the Strait of Gibraltar and Mediterra- hardly any change to rises of many tens of centimetres.
nean waters flowing out to the Atlantic Ocean, is also
expected to weaken. In parallel, seawater salinity will
become progressively higher by roughly 0.5 units over
the next 100 years.
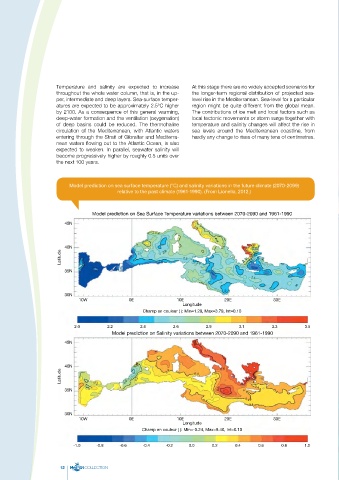
Model prediction on sea surface temperature (°C) and salinity variations in the future climate (2070-2099)
relative to the past climate (1961-1990). (From Lionello, 2012.)
Model prediction on Sea Surface Temperature variations between 2070-2090 and 1961-1990
45N
Latitude 40N
35N
30N
10W 0E 10E 20E 30E
Longitude
Champ en couleur ( ): Min=1.29, Max=3.79, Int=0.10
2.0 2.2 2.4 2.6 2.9 3.1 3.3 3.5
Model prediction on Salinity variations between 2070-2090 and 1961-1990
45N
Latitude 40N
35N
30N
10W 0E 10E 20E 30E
Longitude
Champ en couleur ( ): Min=-0.24, Max=5.40, Int=0.10
-1.0 -0.8 -0.6 -0.4 -0.2 0.0 0.2 0.4 0.6 0.8 1.0
12 COLLECTION