
Page 5 - 05 albarello
P. 5
Finite element modelling of the recent-present deformation pattern in the Calabrian are and surrounding regions
SICILY SICILY
Edcr1 CALABRIA
CALABRIA
::o::
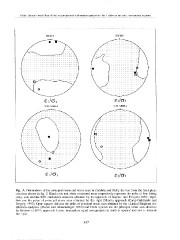
Fig. 3. Orientations of the principal strain and stress axes in Calabria and Sicily derived from the fault plane
solutions shown in fig. 2. Black dots and white contoured areas respectively represent the poles of best fitting
stress axis and the 90% confidence intervals obtained by the approach of Gephart and Forsyth (1984). Open
dots are the poles of principal stress axes obtained by the right Dihedra approach (Carey-Gahilardis and
Vergely, 1992). Open squares indicate the poles of principal strain axes obtained by the «Linked Bingham dis-
tribution analysis>> (Marret and Allmendinger, 1990) and black squares are the principal strain axes obtained
by Kostrov's (1974) approach. Lower hemisphere equal area projection; north is upward and east is towards
the right.
837