
Page 2 - Iannucci_alii_2016
P. 2
GNGTS 2016 sessione 2.2
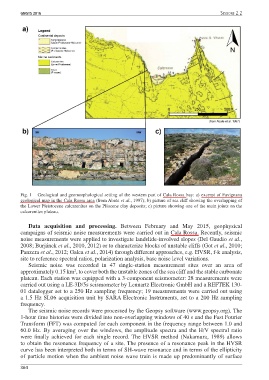
Fig. 1 – Geological and geomorphological setting of the western part of Cala Rossa bay: a) excerpt of Favignana
geological map in the Cala Rossa area (from Abate et al., 1997); b) picture of sea cliff showing the overlapping of
the Lower Pleistocene calcarenites on the Pliocene clay deposits; c) picture showing one of the main joints on the
calcarenites plateau.
Data acquisition and processing. Between February and May 2015, geophysical
campaigns of seismic noise measurements were carried out in Cala Rossa. Recently, seismic
noise measurements were applied to investigate landslide-involved slopes (Del Gaudio et al.,
2008; Burjánek et al., 2010, 2012) or to characterize blocks of unstable cliffs (Got et al., 2010;
Panzera et al., 2012; Galea et al., 2014) through different approaches, e.g. HVSR, f-k analysis,
site to reference spectral ratios, polarization analysis, base noise level variations.
Seismic noise was recorded in 47 single-station measurement sites over an area of
2
approximately 0.15 km , to cover both the unstable zones of the sea cliff and the stable carbonate
plateau. Each station was equipped with a 3-component seismometer: 28 measurements were
carried out using a LE-3D/5s seismometer by Lennartz Electronic GmbH and a REFTEK 130-
01 datalogger set to a 250 Hz sampling frequency; 19 measurements were carried out using
a 1.5 Hz SL06 acquisition unit by SARA Electronic Instruments, set to a 200 Hz sampling
frequency.
The seismic noise records were processed by the Geopsy software (www.geopsy.org). The
1-hour time histories were divided into non-overlapping windows of 40 s and the Fast Fourier
Transform (FFT) was computed for each component in the frequency range between 1.0 and
60.0 Hz. By averaging over the windows, the amplitude spectra and the H/V spectral ratio
were finally achieved for each single record. The HVSR method (Nakamura, 1989) allows
to obtain the resonance frequency of a site. The presence of a resonance peak in the HVSR
curve has been interpreted both in terms of SH-wave resonance and in terms of the ellipticity
of particle motion when the ambient noise wave train is made up predominantly of surface
364