
Page 3 - Iannucci_alii_2016
P. 3
GNGTS 2016 sessione 2.2
waves (Bonnefoy-Claudet et al., 2006). The wavefield is a combination of both types and the
shape of the HVSR curve provides information about the shear wave velocity profile in shallow
sediments (Galea et al., 2014).
Polarization analysis was introduced by Vidale (1986) and implemented by Burjánek et al.
(2010) by adopting a continuous wavelet transform (CWT). The particle motion is characterized
at given time and frequency by a 3D ellipse. The WAVEPOL package outputs the analysis
of ambient noise time-series in visual representations of combined angular and frequency
dependence. The ellipticity of the particle motion is defined as the ratio of the semi-minor axis
to the semi-major axis of the ellipse (i.e. 1 represents circular particle motion and 0 purely
linear motion), pointing out the polarization effects. It is represented as a 3D histogram of
ellipticity versus frequency. Histograms of strike of the ellipse major axis are represented as
circles on a polar plot, in which the frequency increases along the radius, and a colour ramp is
used to denote amplitude in each histogram.
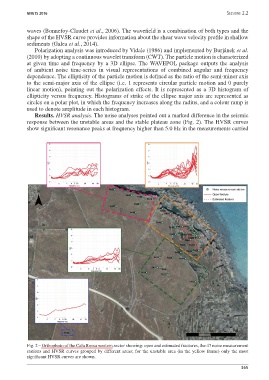
Results. HVSR analysis. The noise analyses pointed out a marked difference in the seismic
response between the unstable areas and the stable plateau zone (Fig. 2). The HVSR curves
show significant resonance peaks at frequency higher than 5.0 Hz in the measurements carried
Fig. 2 – Orthophoto of the Cala Rossa western sector showing: open and estimated fractures, the 47 noise measurement
stations and HVSR curves grouped by different areas; for the unstable area (in the yellow frame) only the most
significant HVSR curves are shown.
365