
Page 109 - MSc_thesis_R A Kil
P. 109
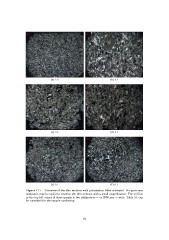
(a) 1.2      (b) 2.1

(c) 3.2      (d) 4.1

(e) 5.1      (f ) 6.1

Figure C.1 – Overview of the thin sections with polarisation filter activated. For grain-size
analysis it may be useful to examine the thin sections with a small magnification. The red line
in the top left corner of these images is two millimetres — or 2000 µm — wide. Table 3.1 can
be consulted for the sample numbering.

         82