
Page 11 - Seismogenic_evidence_2007
P. 11
06 133-20 06(209-222) 25-06-2007 14:24 Pagina 219
SEISMOGENIC EVIDENCE OF ONGOING COMPRESSION IN EASTERN-CENTRAL ITALY AND MAINLAND SICILY: A COMPARISON 219
TABLE 3
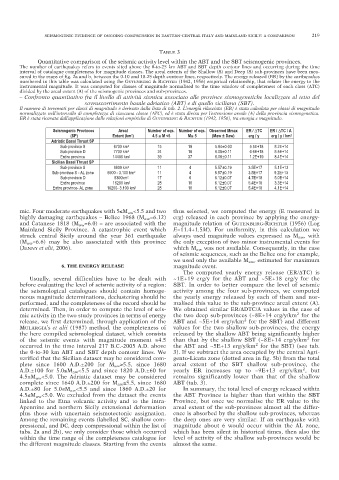
Quantitative comparison of the seismic activity level within the ABT and the SBT seismogenic provinces.
The number of earthquakes refers to events sited above the 0-to-25 km ABT and SBT depth contour lines and occurring during the time
interval of catalogue completeness for magnitude classes. The areal extents of the Shallow (S) and Deep (S) sub-provinces have been mea-
sured in the maps of fig. 2a and b, between the 0-10 and 10-25 depth contour lines, respectively. The energy released (ER) by the earthquakes
numbered in this table was calculated using the GUTENBERG & RICHTER (1942, 1956) empirical relationship, that relates the energy to the
instrumental magnitude. It was computed for classes of magnitude normalised to the time window of completeness of each class (∆TC)
divided by the areal extent (A) of the seismogenic provinces and sub-provinces.
– Confronto quantitativo fra il livello di attività sismica associato alle province sismogenetiche localizzate al tetto del
sovrascorrimento basale adriatico (ABT) e di quello siciliano (SBT).
Il numero di terremoti per classi di magnitudo è derivato dalla lista di tab. 2. L’energia rilasciata (ER) è stata calcolata per classi di magnitudo
normalizzate nell’intervallo di completezza di ciascuna classe (∆TC), ed è stata divisa per l’estensione areale (A) della provincia sismogenetica.
ER è stata ricavata dall’applicazione dalle relazioni empiriche di GUTENBERG & RICHTER (1942, 1956), tra energia e magnitudo.
Seismogenic Provinces Areal Number of eqs. Number of eqs. Observed Mmax ER / ∆TC ER / ∆TC / A
(SP) Extent (km 2 ) 4.5 ≤≤ ≤≤ M <5 M≥≥ ≥≥ 5 (Maw ± Daw) erg / y erg / y / km 2
Adriatic Basal Thrust SP
Sub-province S 6700 km 2 15 19 5.94±0.03 5.5E+18 8.2E+14
Sub-province D 7700 km 2 24 18 6.08±0.11 6.6E+18 8.5E+14
Entire province 14400 km 2 39 37 6.08±0.11 1.2E+19 8.4E+14
Sicilian Basal Thrust SP
Sub-province S 6900 km 2 11 4 5.57±0.19 3.5E+17 5.1E+13
Sub-province S - AL zone 6900 - 3.100 km 2 11 4 5.57±0.19 3.5E+17 9.2E+13
Sub-province D 9300km 2 17 6 6.12±0.07 4.7E+18 5.0E+14
Entire province 16200 km 2 28 10 6.12±0.07 5.4E+18 3.3E+14
Entire province- AL zone 16200- 3.100 km 2 28 10 6.12±0.07 5.4E+18 4.1E+14
mic. Four moderate earthquakes with 5≤M aw <5.5 and two thus selected, we computed the energy (E measured in
highly damaging earthquakes – Belice 1968 (M aw =6.12) erg) released in each province by applying the energy-
and Catanese 1818 (M aw =6.0) – are associated with the magnitude relation of GUTENBERG-RICHTER (1956) (Log
Mainland Sicily Province. A catastrophic event which E=11.4+1.5M). For uniformity, in this calculation we
struck central Sicily around the year 361 earthquake always used magnitude values expressed as M aw , with
(M aw =6.6) may be also associated with this province the only exception of two minor instrumental events for
(JENNY et alii, 2006). which M aw was not available. Consequently, in the case
of seismic sequences, such as the Belice one for example,
we used only the available M aw , estimated for maximum
6. THE ENERGY RELEASE magnitude event.
The computed yearly energy release (ER/∆TC) is
Usually, several difficulties have to be dealt with ~1E+19 erg/y for the ABT and ~5E+18 erg/y for the
before evaluating the level of seismic activity of a region: SBT. In order to better compare the level of seismic
the seismological catalogues should contain homoge- activity among the four sub-provinces, we computed
neous magnitude determinations, declustering should be the yearly energy released by each of them and nor-
performed, and the completeness of the record should be malised this value to the sub-province areal extent (A).
determined. Then, in order to compute the level of seis- We obtained similar ER/∆DTC/A values in the case of
2
mic activity in the two study provinces in terms of energy the two deep sub-provinces (~8E+14 erg/y/km for the
2
release, we first determined, through application of the ABT and ~5E+14 erg/y/km for the SBT) and different
MULARGIA’s et alii (1987) method, the completeness of values for the two shallow sub-provinces, the energy
the here compiled seismological dataset, which consists released by the shallow ABT being significantly higher
2
of the seismic events with magnitude moment ≥4.5 than that by the shallow SBT (~8E+14 erg/y/km for
2
occurred in the time interval 217 B.C.-2005 A.D. above the ABT and ~5E+13 erg/y/km for the SBT) (see tab.
the 0-to-30 km ABT and SBT depth contour lines. We 3). If we subtract the area occupied by the central Agri-
verified that the Sicilian dataset may be considered com- gento-Licata zone (dotted area in fig. 5b) from the total
plete since 1600 A.D.±200 for M aw ≥5.5, since 1680 areal extent of the SBT shallow sub-province, the
2
A.D.±100 for 5.0≤M aw <5.5 and since 1820 A.D.±60 for yearly ER increases up to ~9E+13 erg/y/km , but
4.5≤M aw <5.0. The Adriatic dataset may be considered remains significantly lower than that of the shallow
complete since 1640 A.D.±200 for M aw ≥5.5, since 1680 ABT (tab. 3).
A.D.±80 for 5.0≤M aw <5.5 and since 1860 A.D.±20 for In summary, the total level of energy released within
4.5≤M aw <5.0. We excluded from the dataset the events the ABT Province is higher than that within the SBT
linked to the Etna volcanic activity and to the intra- Province, but once we normalise the ER value to the
Apennine and northern Sicily extensional deformation areal extent of the sub-provinces almost all the differ-
plus those with uncertain seismotectonic assignation. ence is absorbed by the shallow sub-provinces, whereas
Among the remaining events (labelled SC, shallow com- the deep ones are very similar. If an earthquake with
pressional, and DC, deep compressional within the list of magnitude about 6 would occur within the AL zone,
tabs. 2a and 2b), we only consider those which occurred which has been silent in historical times, then also the
within the time range of the completeness catalogue for level of activity of the shallow sub-provinces would be
the different magnitude classes. Starting from the events almost the same.