
Page 8 - Bennett_DiFranco_alii2018
P. 8
8of10 BENNETT ET AL.
Social impacts Good governance
10 10 10
8 8 8
6 6 6
4 4 4
2 2 2
0 0 0
neutral
neutral
strong support
somewhat in opposition
strong support
strong opposition somewhat in support strong opposition somewhat in support strong opposition somewhat in support
somewhat in opposition
strong support
neutral
somewhat in opposition
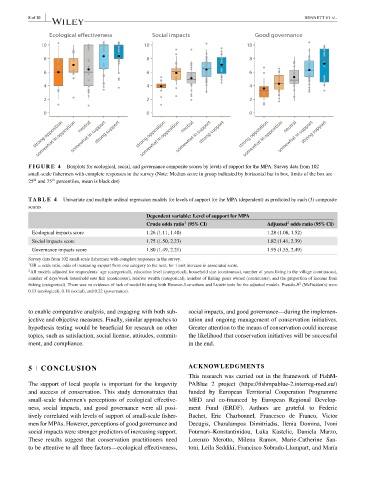
FIGURE 4 Boxplots for ecological, social, and governance composite scores by levels of support for the MPA. Survey data from 102
small-scale fishermen with complete responses in the survey (Note: Median score in group indicated by horizontal bar in box, limits of the box are
th
th
25 and 75 percentiles, mean is black dot)
TA BLE 4 Univariate and multiple ordinal regression models for levels of support for the MPA (dependent) as predicted by each (3) composite
scores
Dependent variable: Level of support for MPA
2
1
Crude odds ratio (95% CI) Adjusted odds ratio (95% CI)
Ecological impacts score 1.26 (1.11, 1.40) 1.28 (1.08, 1.52)
Social impacts score 1.75 (1.50, 2.23) 1.82 (1.41, 2.39)
Governance impacts score 1.80 (1.49, 2.21) 1.95 (1.55, 2.49)
Survey data from 102 small-scale fishermen with complete responses in the survey.
1
OR = odds ratio, odds of increasing support from one category to the next, for 1 unit increase in associated score.
2 All models adjusted for respondents’ age (categorical), education level (categorical), household size (continuous), number of years living in the village (continuous),
number of days/week household eats fish (continuous), relative wealth (categorical), number of fishing gears owned (continuous), and the proportion of income from
2
fishing (categorical). There was no evidence of lack of model fit using both Hosmer–Lemeshow and Lipsitz tests for the adjusted models. Pseudo-R (McFadden's) were
0.13 (ecological), 0.18 (social), and 0.22 (governance).
to enable comparative analysis, and engaging with both sub- social impacts, and good governance—during the implemen-
jective and objective measures. Finally, similar approaches to tation and ongoing management of conservation initiatives.
hypothesis testing would be beneficial for research on other Greater attention to the means of conservation could increase
topics, such as satisfaction, social license, attitudes, commit- the likelihood that conservation initiatives will be successful
ment, and compliance. in the end.
5 CONCLUSION ACKNOWLEDGMENTS
This research was carried out in the framework of FishM-
The support of local people is important for the longevity PABlue 2 project (https://fishmpablue-2.interreg-med.eu/)
and success of conservation. This study demonstrates that funded by European Territorial Cooperation Programme
small-scale fishermen's perceptions of ecological effective- MED and co-financed by European Regional Develop-
ness, social impacts, and good governance were all posi- ment Fund (ERDF). Authors are grateful to Federic
tively correlated with levels of support of small-scale fisher- Bachet, Eric Charbonnel, Francesco de Franco, Victor
men for MPAs. However, perceptions of good governance and Decugis, Charalampos Dimitriadis, Ilenia Domina, Ivoni
social impacts were stronger predictors of increasing support. Fournari–Konstantinidou, Luka Kastelic, Daniela Marzo,
These results suggest that conservation practitioners need Lorenzo Merotto, Milena Ramov, Marie-Catherine San-
to be attentive to all three factors—ecological effectiveness, toni, Leila Seddiki, Francisco Sobrado-Llompart, and María