
Page 6 - Bennett_DiFranco_alii2018
P. 6
6of10 BENNETT ET AL.
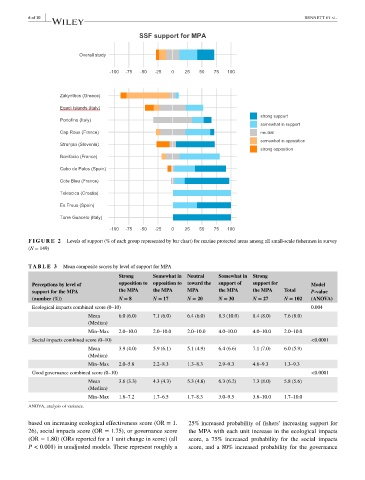
SSF support for MPA
Overall study
-100 -75 -50 -25 0 25 50 75 100
Zakynthos (Greece)
Egadi Islands (Italy)
strong support
Portofino (Italy)
somewhat in support
Cap Roux (France) neutral
somewhat in opposition
Strunjan (Slovenia)
strong opposition
Bonifacio (France)
Cabo de Palos (Spain)
Cote Bleu (France)
Telescica (Croatia)
Es Freus (Spain)
Torre Guaceto (Italy)
-100 -75 -50 -25 0 25 50 75 100
FIGURE 2 Levels of support (% of each group represented by bar chart) for marine protected areas among all small-scale fishermen in survey
(N = 149)
TA BLE 3 Mean composite scores by level of support for MPA
Strong Somewhat in Neutral Somewhat in Strong
Perceptions by level of opposition to opposition to toward the support of support for Model
support for the MPA the MPA the MPA MPA the MPA the MPA Total P-value
(number (%)) N = 8 N = 17 N = 20 N = 30 N = 27 N = 102 (ANOVA)
Ecological impacts combined score (0–10) 0.004
Mean 6.0 (6.0) 7.1 (6.0) 6.4 (6.0) 8.3 (10.0) 8.4 (8.0) 7.6 (8.0)
(Median)
Min–Max 2.0–10.0 2.0–10.0 2.0–10.0 4.0–10.0 4.0–10.0 2.0–10.0
Social impacts combined score (0–10) <0.0001
Mean 3.9 (4.0) 5.9 (6.1) 5.1 (4.9) 6.4 (6.6) 7.1 (7.0) 6.0 (5.9)
(Median)
Min–Max 2.0–5.8 2.2–8.3 1.3–8.3 2.9–9.3 4.6–9.3 1.3–9.3
Good governance combined score (0–10) <0.0001
Mean 3.6 (3.3) 4.3 (4.3) 5.3 (4.8) 6.3 (6.2) 7.3 (8.0) 5.8 (5.6)
(Median)
Min–Max 1.8–7.2 1.7–6.5 1.7–8.3 3.0–9.5 3.8–10.0 1.7–10.0
ANOVA, analysis of variance.
based on increasing ecological effectiveness score (OR = 1. 25% increased probability of fishers’ increasing support for
26), social impacts score (OR = 1.75), or governance score the MPA with each unit increase in the ecological impacts
(OR = 1.80) (ORs reported for a 1 unit change in score) (all score, a 75% increased probability for the social impacts
P < 0.001) in unadjusted models. These represent roughly a score, and a 80% increased probability for the governance