Page 4 - Colonese_Zanchetta_&C_2015
P. 4

fall within the range of isotope values of modern specimens from the western
              Mediterranean  (Figure  2A).  Δδ  adjusts  values  for  site-specific environmental
                                   18
              condition (e.g. elevation, δ O of rainfall, temperature) and species-specific


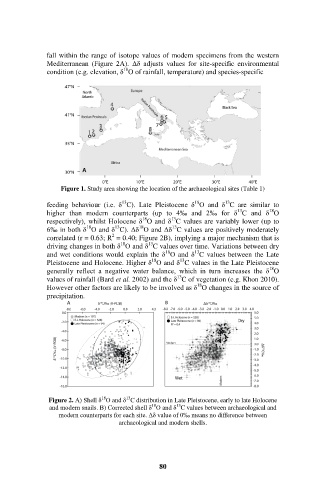
                  Figure 1. Study area showing the location of the archaeological sites (Table 1)

                                                                13
                                                       18
                                   13
              feeding  behaviour  (i.e.  δ C).  Late  Pleistocene  δ O and δ C are similar to
                                                                            18
                                                                   13
              higher  than  modern  counterparts  (up  to  4‰  and  2‰  for  δ C  and  δ O
                                                 13
                                         18
              respectively), whilst Holocene δ O and δ C values are variably lower (up to
                                 13
                         18
                                        18
                                                 13
              6‰ in both δ O and δ C). Δδ O and Δδ C values are positively moderately
                                2
              correlated (r = 0.63; R  = 0.40; Figure 2B), implying a major mechanism that is
                                   18
                                          13
              driving changes in both δ O and δ C values over time. Variations between dry
                                                       13
                                               18
              and wet conditions would explain the δ O and δ C values between the Late
                                                   13
                                           18
              Pleistocene and Holocene. Higher δ O and δ C values in the Late Pleistocene
                                                                            18
              generally  reflect  a  negative  water  balance,  which  in  turn  increases  the  δ O
                                                  13
              values of rainfall (Bard et al. 2002) and the δ C of vegetation (e.g. Khon 2010).
                                                        18
              However other factors are likely to be involved as δ O changes in the source of
              precipitation.


                                    13
                             18
               Figure 2. A) Shell δ O and δ C distribution in Late Pleistocene, early to late Holocene
                                                  13
                                           18
               and modern snails. B) Corrected shell δ O and δ C values between archaeological and
                 modern counterparts for each site. Δδ value of 0‰ means no difference between
                                  archaeological and modern shells.


                                             80
   1   2   3   4   5   6   7