
Page 4 - DiMaidaetal2013
P. 4
G. Di Maida et al. / Marine Environmental Research 87-88 (2013) 96e102 99
that the age had a negative effect on rhizome elongation
(À0.45 Æ 0.5 mm/year/shoot; P < 0.001). Standard deviations of
the random effects were significantly greater than zero
(P < 0.001). This means that the degree of differences of rhizome
elongation due to substratum actually changed among the four
locations (Fig. 3).
Mean annual leaf production estimated by GLMM on rock was
equal to 8.3 Æ 0.4 n/year/shoot, and did not show any significant
differences with other two substrata (P > 0.05; Table 1). Random
effects were negligible (P > 0.05; Table 1) indicating that there was
a substantial homogeneity in mean leaf production among sub-
strata within each location (Fig. 3).
3.2. Shoot density
Shoot density estimated on meadows growing on rock was
222.3 Æ 15.8 n. shoots/m2 (Table 1) and differences between the
other two substrata were on average not significant (P > 0.05).
However, variance components of random effects were signifi-
cantly greater than zero; thus, the magnitude of difference of mean
values between sand and matte vs. rock varied largely among lo-
cations (P < 0.001) (Fig. 3).
3.3. Leaf biometry
Shoots growing on rock had mean surface estimated by LMM
equal to 243.88 Æ 13.8 cm2/shoot, a value significantly different
from sand and matte, where increments of 45.2 Æ 19.0 and
113.6 Æ 20.7 cm2/shoot were respectively detected (P < 0.001)
(Table 1). The estimated standard deviations of the random effects
were not statistically different from zero (P > 0.05). This means that
the degree of differences in shoot surface among substrata did not
change across locations (Fig. 4; Table 1). For this variable age
seemed to have a negative effect, with an estimated reduction of
3.7 Æ 1.8 cm2/shoot per year of growth (P < 0.05).
Leaf length showed lowest mean values on rock respect to sand
and matte, where leaves resulted longer of 15.9 Æ 3.3 and
17.5 Æ 2.9 cm, respectively (Table 1). Again, the random effects were
not significant (P > 0.05), thus the magnitude of differences among
substrata were quantitatively similar in all locations (Fig. 4). The
model detected no age effect for this response variable (P > 0.05;
Table 1). The LMM detected no differences in leaf width between
rock vs. sand and matte (P > 0.05; Table 1). Variance components
were negligible and not significant (P > 0.05), thus leaf width was
homogenous among substrata in all locations (Fig. 4).
Coefficient A ranged from 52.9 to 65.2% at Mondello, from 51.8 to
65.8% at Solanto and from 21.3 to 32.5% at Trappeto (Fig. 4). No
statistical differences in frequency distribution of leaves having lost
their apex across substrata within each location were detected (chi-
square test; P > 0.05) (Table 2).
4. Discussion
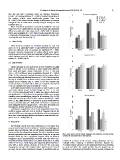
Our findings clearly show that substratum is a key factor that Fig. 3. Mean values (ÆSE) of rhizome elongation, leaf production and shoot density
may account for patterns of variation in P. oceanica morphology and estimated for each substratum in four locations.
growth. More specifically, GLM and LM models including different
features of the data allowed us to isolate the effect of substratum on considered as biases in the present study, substratum exerts a
rhizome elongation and leaf biometry from those due to age and multiple effect, resulting in different biometric features for
location. Shoot age has a significant negative effect on rhizome P. oceanica shoots settled on rocky substratum from those growing
elongation and is quantitatively consistent with the effect esti- on sand and matte. The model predicts that the growth rate of
mated in previous studies (Calvo et al., 2006; Tomasello et al., 2007, shoots on rock decreases from 42% to 22% on average compared to
2009; Vizzini et al., 2010). Aging also negatively affects leaf biom-
etry, with a shoot surface decrease of 3.68 cm2 for each year,
showing that the age effect involves other plant features. Thus, if
we leave out the above-mentioned changes in variability that we