Page 7 - EAI-4_2015_69-75
P. 7

ENEA researchers provided all of the scientific content of list. A 3D drawing indicated with arrows the directions                         Research & development

the books by describing the coastal environment of Egadi followed by divers and the presence of main, relevant

Islands,theitinerariesintermsofecologicalandgeological species (Figure 7).

characteristics, and produced a comprehensive species A further 2D drawing, representing a cross section of the

                                                                                             itinerary, was realised with the aim

                                                                                             of providing a detailed illustration

                                                                                             of geomorphology of the site and

                                                                                             presence and distribution along

                                                                                             depth of the species characterizing

                                                                                             that specific site (Figure 8).

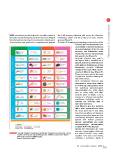
                                                                                             Particular attention was paid to

                                                                                             the legend with a detailed list of

                                                                                             species,seabed characteristics and

                                                                                             icons with fine morphologic details

                                                                                             illustrating species. Different

                                                                                             colours in the legend were used to

                                                                                             represent different taxa (Figure 9).

                                                                                             Those icons were used in the maps

                                                                                             of paths and transects showing the

                                                                                             dive observations.

                                                                                             Each underwater itinerary was

                                                                                             described in detail from surface

                                                                                             to bottom and information about

                                                                                             the principal morphological

                                                                                             characteristics (i.e. rock, shoal,

                                                                                             cave or rocky wall), and other

                                                                                             features (such as depth, current,

                                                                                             exposure to adverse sea-weather

                                                                                             conditions, visibility), useful to

                                                                                             evaluate the difficulty level of

                                                                                             dive, were provided.

                                                                                             Each itinerary was also provided

                                                                                             with a score represented by stars:

                                                                                             the score, from one to four stars,

                                                                                             from low to excellent, was based on

                                                                                             nature conservation relevance, thus

                                                                                             considering biological relevance,

                                                                                             species and habitat presence,

                                                                                             species vulnerability and rarity,

                                                                                             geomorphologic characteristics,

                                                                                             aesthetic view of the itinerary.

                                                                                             Among the itineraries, the most

FIGURE 9 Example of legend, showing the detailed list of species and icons used in maps      common topographies observed
              VMWH[OZHUK[YHUZLJ[ZYLWYLZLU[PUNZWLJPLZ+PɈLYLU[JVSV\YZPU[OLSLNLUK
              ^LYL\ZLK[VYLWYLZLU[KPɈLYLU[[H_H                                           are almost vertical rocky walls,
              Source: Cocito et al., 2014                                                    together with rocks and shoals,
                                                                                             reaching a maximum depth of

                                                                                             73EAI Energia, Ambiente e Innovazione 4/2015
   2   3   4   5   6   7   8   9