
Page 11 - ENERGIA_MARE
P. 11
Author's personal copy
948 L. Liberti et al. / Renewable Energy 50 (2013) 938e949
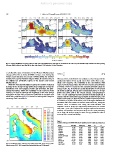
Fig. 13. Seasonal distribution of average power per unit crest in the Mediterranean. Averages are calculated for the entire ten years simulation. DJF stands for December, January,
February; MAM for March, April, May; JJA for June, July, August; SON September, October, November.
a considerable range of variation. In the Western Mediterranean COV ¼ s (13)
average power flux is above 20 kW/m in large areas during the m
winter season but does not exceed 9 kW/m during the summer
months. The seasonal variation range is wider, in relative terms, in where m and s are deï¬ned in our analysis as the average and the
the slightly less productive regions of the Eastern and Central
Mediterranean. standard deviation of the yearly mean wave power flux respec-
tively. COV measures the variability of the observations with
While the overall proï¬tability of a given site could be evaluated respect to their average value. The COV of a constant series of values
in terms of the average energy production, taking into account its is 0 while a COV of 1 means that the standard deviation equals the
distribution over wave heights, periods and directions, the inter- average value. Fig. 14 shows the spatial distribution of COV around
annual fluctuations deï¬ne the variability of the expected yearly the Italian peninsula. Average inter-annual fluctuations of average
revenues. In order to estimate the magnitude of the inter-annual power flux above 20% of the overall average, corresponding to
fluctuation we take into account the Coefï¬cient of Variation COV COV > 0.2 are commonly observed around the Italian peninsula. It
which was proposed by [4] as a measure of wave power temporal appears that the fluctuation range is higher in sheltered areas. The
variability. COV is deï¬ned as: highest COV values are observed in the southern Tyrrhenian where
it exceeds 0.4, in parts of the Ionian, and in the region between the
mainland and Corsica where it reaches values above 0.3. Along the
western coast of Sardinia and along the north-western and
southern coast of Sicily the inter-annual fluctuations are milder
with COV < 0.25. The results of the analysis conï¬rm that western
Sardinia and southern and western Sicily are the most promising
areas along the Italian coast for wave energy production also in
terms of inter-annual variability.
Table 9
Statistics of buoy and ECMWF WAM model signiï¬cant wave height (Hs) comparison.
Fig. 14. Distribution of the coefï¬cient of variation (COV) of the yearly average power Buoy Bias (m) Rmse (m) Slope si d
fluxes for years 2001e2010 around Italy. Dashed grid lines are 200 km apart.
Alghero À0.185 0.398 0.791 0.355 0.946
Ancona À0.274 0.417 0.612 0.553 0.825
Catania À0.212 0.338 0.648 0.544 0.824
Crotone À0.101 0.278 0.822 0.376 0.935
La Spezia À0.289 0.424 0.628 0.530 0.857
Mazara del Vallo À0.097 0.267 0.883 0.263 0.961
Ortona À0.177 0.318 0.668 0.516 0.871
Ponza À0.146 0.287 0.804 0.345 0.939
Monopoli À0.201 0.346 0.702 0.479 0.875
Cetraro À0.110 0.272 0.801 0.382 0.941
Capo Gallo 0.431 1.022 0.575 0.873
0.127