Page 7 - ENERGIA_MARE
P. 7

Author's personal copy

944 L. Liberti et al. / Renewable Energy 50 (2013) 938e949

                                                                                                      Balearic Islands and north Africa. The neighboring region located
                                                                                                      in the Sicily channel, off the north-western and southern Sicilian
                                                                                                      coasts, is also very productive with an average wave energy flux
                                                                                                      per unit crest that reaches 9 kW/m. Slightly lower wave power
                                                                                                      appears to be available in central Mediterranean and southern
                                                                                                      Ionian Sea with average values not exceeding 8 kW/m near the
                                                                                                      coast in the eastern section. The western part of the Levantine
                                                                                                      basin exhibits similar values reaching almost 8 kW/m. The Adriatic
                                                                                                      Sea, where average wave power does not exceed 3 kW/m, is one of
                                                                                                      the least productive regions. Similar values are observed in the
                                                                                                      most sheltered parts of the Ionian and Tyrrhenian between the
                                                                                                      mainland and Corsica and near the Messina Strait. The Aegean Sea,
                                                                                                      despite its semi-enclosed configuration, appears to be more
                                                                                                      productive than the Adriatic Sea at least off the continental coast.
                                                                                                      The wave power actually available at locations near the coast
                                                                                                      follows the same spatial pattern but, as expected, amounts to
                                                                                                      lower values compared to the open sea. Wave energy availability
                                                                                                      near the coast for selected sites in the Mediterranean shown in
                                                                                                      Fig. 8 is summarized in Table 8.

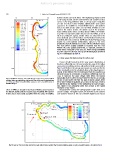
Fig. 9. Distribution of average wave power flux per unit crest on western Sardinia          3.2. Wave power distribution along the Italian coast
coastline. Values are calculated on a line located 12 km off the coast. Dashed grid lines
are 50 km apart. Wave energy distribution among sea states at marked locations is              A more detailed overview of the wave power distribution at
described in Fig. 11.                                                                      locations sufficiently near the most productive areas of the Italian
                                                                                           coast, western Sardinia, western and southern Sicily is presented in
above 12 kW/m, is located in the western Mediterranean between                             Figs. 9 and 10 where the average wave power per unit crest for the
the Balearic Islands and the western coast of Sardinia. Wave power                         entire simulated period is calculated along a line placed approxi-
in this area is most easily accessible from the coasts of Sardinia,                        mately 12 km offshore. The 12 km distance from the coastline was
                                                                                           selected because it corresponds to positions sufficiently near the
                                                                                           coast to represent the wave climate right before the bottom
                                                                                           topography starts to affect the wave field. The line lies, on average,
                                                                                           on the second model cell from the land at depths always above
                                                                                           50 m. Wave energy in shallower areas, closer to the coast, tends to
                                                                                           be affected by the influence of the bathymetry on wave propaga-
                                                                                           tion, which is not adequately taken into account at the spatial
                                                                                           resolution of our model.

                                                                                               Along western Sardinia the average power ranges from 7.5 to
                                                                                           almost 12 kW/m. The highest values are observed on the northern
                                                                                           and southern sections of the coast, between Alghero and Asinara

Fig. 10. Same as 9 but on western north-western and southern Sicily coastline. Wave energy distribution among sea states at marked locations is described in Fig. 12.
   2   3   4   5   6   7   8   9   10   11   12