
Page 4 - Espinosa_alii_2013
P. 4
The marine limpet Patella ferruginea 269
1,000
(a) (b)
100
10
1
1,000
(c) (d)
100
10
1
1,000
(e) (f)
100
10
1
1,000
(g) (h)
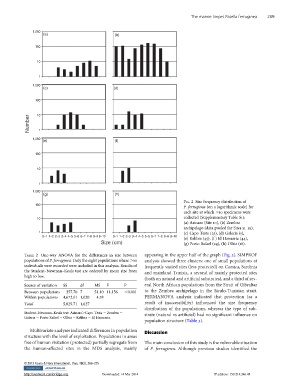
FIG. 2 Size frequency distribution of
100
P. ferruginea (on a logarithmic scale) for
each site at which .10 specimens were
10 collected (Supplementary Table S1):
(a) Asinara (Site 10), (b) Zembra
archipelago (data pooled for Sites 51–55),
1 (c) Capo Testa (25), (d) Galeria (1),
0–1 1–2 2–3 3–4 4–5 5–6 6–7 7–8 8–9 9–10 0–1 1–2 2–3 3–4 4–5 5–6 6–7 7–8 8–9 9–10
(e) Kelibia (45), (f ) El Haouaria (44),
(g) Porto Rafael (24), (h) Olbia (18).
TABLE 2 One-way ANOVA for the differences in size between appearing in the upper half of the graph (Fig. 3). SIMPROF
populations of P. ferruginea. Only the eight populations where .10 analysis showed three clusters: one of small populations at
individuals were recorded were included in this analysis. Results of frequently visited sites (less protected) on Corsica, Sardinia
the Student–Newman–Keuls test are ordered by mean size from and mainland Tunisia, a second of mainly protected sites
high to low.
(both on natural and artificial substrates), and a third of sev-
Source of variation SS df MS F P eral North African populations from the Strait of Gibraltar
Between populations 357.70 7 51.10 11,156 ,0.001 to the Zembra archipelago in the Siculo-Tunisian strait.
Within populations 4,672.01 1,020 4.58 PERMANOVA analysis indicated that protection (as a
Total 5,029.71 1,027 result of inaccessibility) influenced the size frequency
distribution of the populations, whereas the type of sub-
Student–Newman–Keuls test: Asinara.Capo Testa 5 Zembra 5 strate (natural vs artificial) had no significant influence on
Galeria 5 Porto Rafael 5 Olbia 5 Kelibia 5 El Haouaria.
population structure (Table 3).
Multivariate analyses indicated differences in population
Discussion
structure with the level of exploitation. Populations in areas
free of human visitation (protected) partially segregate from The main conclusion of this study is the vulnerable situation
the human-affected sites in the MDS analysis, mainly of P. ferruginea. Although previous studies identified the
© 2013 Fauna & Flora International, Oryx, 48(2), 266–275
http://journals.cambridge.org Downloaded: 14 Mar 2014 IP address: 150.214.246.48