
Page 4 - Fattorini_etal2015
P. 4
Fattorini et al.
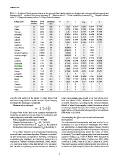
Table 1 – Tenebrionid beetle species richness on the circumsicilian islands, island area, elevation and environmental heterogeneity and
homogeneity. N = number of land cover categories, H = Shannon index; J = Pielou equitability (evenness); DMg = Margalef richness
index; C = Simpson dominance index; d = Berger-Parker dominance.
Island name Species Area Elevation N H J DMg C d
number (km2)
(m)
Lipari 32 37.29 602 4 1.352 0.9756 0.285 0.2675 0.3539
Salina 24 26.38 962 3 0.774 0.7046 0.1965 0.5664 0.7273
Vulcano 22 20.87 500 5 1.38 0.8573 0.4022 0.2794 0.3596
Stromboli 25 12.19 926 3 0.9032 0.8221 0.2126 0.4508 0.5769
Filicudi 15 9.49 774 3 0.7826 0.7124 0.2184 0.549 0.7053
Alicudi 18 5.1 675 3 0.878 0.7992 0.2343 0.4633 0.5882
Panarea 22 3.34 421 3 0.991 0.9021 0.2465 0.4105 0.559
Basiluzzo 3 0.29 165 1 0 0 01 1
Lisca Bianca 4 0.0413 30 1 -0.00734 0 0 1.015 1
Bottaro 7 0.0073 21 1 -0.04376 0 0 1.088 1
Scoglio Faraglione 4 0.0049 35 1 -0.2486 0 0 1.501 1
Pietra del Bagno 3 0.0021 21 1 -0.05123 0 0 1.103 1
Ustica 26 8.6 238 5 1.453 0.9029 0.4415 0.2634 0.3644
Levanzo 18 5.61 278 2 0.4702 0.6784 0.1158 0.7059 0.8208
Favignana 28 19.7 302 3 0.7316 0.6659 0.2023 0.5611 0.7038
Marettimo 16 12.06 686 3 0.5284 0.481 0.2128 0.7312 0.848
Pantelleria 23 86 591 5 1.088 0.6759 0.352 0.4206 0.5935
Linosa 19 5.34 195 3 0.9563 0.8705 0.233 0.4323 0.5837
Lampione 6 0.025 40 1 0 0 01 1
Lampedusa 28 20.2 133 4 1.107 0.7983 0.3026 0.384 0.5299
Malta 46 246 253 7 1.089 0.5599 0.4834 0.3906 0.5152
Gozo 27 67 190 4 1.023 0.7379 0.27 0.3854 0.4397
Comino 11 3.5 70 1 0 0 01 1
Cominotto 2 0.25 8 1 0 0 01 1
Filfla 3 0.06 60 1 0 0 01 1
A is the total surface of the island. C varies from 0 (all some cases ranking only second to, or even ahead of, is-
land area (Biondi 1995, Whittaker & Fernández-Palaci-
land cover categories have equal extent) to 1 (one category os 2007). Moreover, according to the General Dynamic
Model of island biogeography, island elevation is related
dominates the landscape completely). to island geological dynamics and evolution, peaking in is-
lands whose environmental heterogeneity is at maximum
- Shannon index (entropy): H Ai Ai (Whittaker et al. 2010).
A A
= –∑ ln Disentangling the effects of area and environmental
heterogeneity
H ranges from 0 (one land cover category dominates the As environmental heterogeneity and area tend to be in-
terrelated, it is very difficult to disentangle their differ-
landscape completely) to high values for landscapes with ent contribution in determining species richness. Several
studies aimed at testing the relative importance of area and
many categories, each with a small extent. environmental heterogeneity (under the rubric of “habi-
tat diversity”) in island biogeography have used structural
- Pielou equitability (evenness): J = H/ lnN. equation models (e.g., Kohn & Walsh 1994, Hausdorf &
- Margalef richness index: DMg = (N - 1)/ ln(A). Hennig 2005, Fattorini 2006a, Triantis et al. 2005, 2006,
- Berger-Parker dominance: d = Amax/A, i.e. the extent of Karels et al. 2008, Ames et al. 2012, Cabral et al. 2014).
Structural equation models (which include procedures al-
the dominant land cover category (Amax) divided by A. so known as “path analysis”) allow the relative direct and
As a further measure of environmental heterogeneity
we used island maximum elevation. Elevation is correlat-
ed with temperature, precipitation, humidity, wind speed,
evaporation and insolation, so it has been claimed to be a
measure of “habitat” diversity (Newmark, 1986). Moreo-
ver, regression studies often find altitude to be an impor-
tant variable in explaining species numbers on islands, in
4