
Page 5 - Fattorini_etal2015
P. 5
Measuring influence of environmental heterogeneity on island beetles
indirect effects of casual (or predictor) variables to be as- mental indices had 0 values, we used ln(x+1) transforma-
sessed according to an a priori model under several as- tions in all instances.
sumptions (Grace & Pugesek 1998, Grace 2006). The ap-
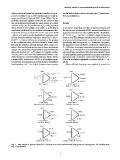
propriate structural equation model for the effect of area Results
and environmental heterogeneity upon species per island
is shown in Fig. 1a. The coefficients a1, b1 and b2 represent Area was an important correlate of species richness and
direct effects of one variable on another; a1 is the simple the species-area relationship (SAR) was well modeled by a
correlation coefficient for the variables environmental het- power function (lnS = [2.356 ± 0.094]+[0.243 ± 0.028]lnA;
erogeneity and area as obtained from the regression lnEH R2 = 0.763, F(1,23) = 74.104, P < 0.00001; Figure 2). Species
= alnA + c; b1 and b2 are the standardised regression coef- richness was also strongly correlated with all measures of
ficients from the multiple regression model lnS = alnA + environmental heterogeneity (i.e., diversity and evenness)
blnEH + c. Indirect effects are calculated as the product (positively) and homogeneity, i.e. dominance (negative-
of the coefficients along the links between causal varia- ly) (Spearman rank correlation coefficients significant at
bles and the response variable through other causal vari- P < 0.05 after Bonferroni sequential corrections with k =
ables. Effect coefficients are the sum of direct and indirect 7; Table 2). All measures of environmental heterogeneity
effects. The species-area relationship is best modelled by were positively correlated with island area, whereas those
the power function (S = cAz ), where S is species number, of environmental homogeneity had a negative correlation
A is area, and c and z are fitted parameters (Drakare et al. (Spearman rank correlation coefficients significant at P <
2006, Martín & Goldenfeld 2006, Fattorini 2006b, 2007b, 0.05 after Bonferroni sequential corrections with k = 7; Ta-
Dengler 2009, Triantis et al. 2012). In all multiple regres- ble 2).
sion models, we linearized power functions by logarithmic When different functions were applied to search for
transformation: lnS = lnc + zlnA. Because some environ-
Fig. 1 – Path models of species richness as a function of area and environmental heterogeneity or homogeneity. All variables were
ln(x+1) transformed.
5