
Page 6 - Fattorini_etal2015
P. 6
Fattorini et al.
5
4
3
lnS
2
1
0
-8 -6 -4 -2 0 2 4 6 8
lnA
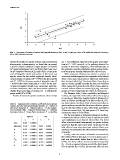
Fig. 2 – Regression of number of species (lnS) against island area (lnA, in km2). Light grey lines: 95% confidence intervals. Dark grey
lines: 95% prediction intervals.
the best fit models for species richness and environmental ure 1. All coefficients reported in the graphs were signif-
heterogeneity or homogeneity, we found that, in general, icant at P < 0.05, except b2 in the pathway obtained for
a power function explained a larger fraction of variance number of land cover categories, which indicates that, in
(R2 comprised between 0.617 and 0.821) than linear mod- this particular case, the contribution given by environmen-
els (R2 comprised between 0.221 and 0.824), except in the tal heterogeneity virtually obliterated the effect of area.
case of Margalef richness and number of land cover cat- When maximum elevation was used as a measure of
egories, where the two models explained virtually identi- environmental heterogeneity, the magnitude of the indirect
cal percentages of variance (R2 = 0.792 for the linear model effect of area (a1b1) on species per island was much lower
and R2 = 0.787 for the power model of Margalef index; R2 than its direct effect (b2). The direct effect of area (b2) on
= 0.824 for the linear model and R2 = 0.821 for the pow- species richness greatly exceeded the direct environment
er model of number of land cover categories), and Berg- effect on species (b1), but the total effect of area, when di-
er-Parker dominance, where the linear model explained a rect and indirect effects are summed (a1b1+b2), was much
slightly larger percentage of variance (R2 = 0.720) than the greater (2.9 times larger) than the effect of environment.
power model (R2 = 0.708). For Shannon index, Pielou equitability and Margalef
Results of structural equation models are shown in Fig- richness, the magnitude of the indirect effect of area (a1b1)
on species per island was roughly similar to (Shannon) or
Table 2 – Spearman rank correlation coefficients (rs) of species lower to (Pielou and Margalef) its direct effect (b2). Us-
richness and area with environmental variables. N = number of ing these indices, the direct effect of environment (b1) on
land cover categories, H = Shannon index; J = Pielou equitabi- species richness exceeded the direct area effect on species
lity (evenness); DMg = Margalef richness index; C = Simpson (b2), but the total effect of area, when direct and indirect
dominance index; d = Berger-Parker dominance. P = probability. effects are summed (a1b1+b2), was greater (1.7 times larg-
er) than the effect of environment.
Species Area For the two indices of dominance (Simpson and Berg-
rP rP er-Parker) the indirect effect of area on species per island
was substantially lower than its direct effect. The direct
s s effect of environmental heterogeneity on species richness
was lower than the direct area effect on species, but the
Area 0.854 <0.00001 0.693 0.0001 total effect of area, when direct and indirect effects were
Elevation 0.588 <0.002 0.883 <0.00001 summed, was about twice the effect of environmental het-
N 0.871 <0.00001 0.816 <0.00001 erogeneity.
H 0.831 <0.00001 0.602 <0.00001 Finally, when the number of habitats was considered,
J 0.734 <0.00001 0.802 <0.00001 the indirect effect of area (a1b1 = 0.517) on species per is-
DMg 0.826 <0.00001 -0.799 <0.00001 land was substantially higher than its direct effect (b2 =
C -0.841 <0.00001 -0.777 <0.00001 0.372). The direct effect of environmental heterogeneity
d -0.873 <0.00001 (b1 = 0.565) on species richness exceeds the direct area ef-
fect on species (b2 = 0.372), but the total effect of area,
6