
Page 5 - Franzitta_et_alii_2017
P. 5
Sustainability 2017, 9, 106 5 of 19
Sustainability 2017, 9, 106 5 of 19
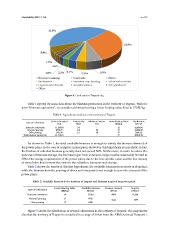
Figure 4. Land uses in Trapani city.
Figure 4. Land uses in Trapani city.
Table 1 reports the main data about the biomass production in the territory of Trapani. With the
Table 1 reports the main data about the biomass production in the territory of Trapani. With the
term “biomass equivalent”, we consider a biomass having a lower heating value fixed to 17 MJ/kg.
term “biomass equivalent”, we consider a biomass having a lower heating value fixed to 17 MJ/kg.
Table 1. Agriculture residues in the territory of Trapani.
Table 1. Agriculture residues in the territory of Trapani.
Surface
Moisture
Surface Occupied Productivity Moisture Fraction Lower Heating Dry Residue
Lower Heating Value
Type of Cultivation [ha] Productivity [%] [MJ/kg] Dry Residue
[t/Year]
[t/ha]
Type of Cultivation Occupied Fraction Value
[t/Year]
Extensive cultivation 11,545.60 3.0 [t/ha] - 14 34,636.80
[ha]
17
Vineyard pruning 8592.73 2.8 50 [%] [MJ/kg] 12,029.82
2056.23
Olive pruning
17
Extensive cultivation 1631.93 2.1 3.0 40 - 14 34,636.80
11,545.60
Total biomass equivalent 21,770.26 - 17 42,610.48
Vineyard pruning 8592.73 2.8 50 17 12,029.82
Olive pruning 1631.93 2.1 40 17 2056.23
As shown in Table 1, the total available biomass is enough to satisfy the biomass demand of
Total biomass equivalent 21,770.26 - 17 42,610.48
the power plant, in the case of complete interception. However, this hypothesis is unrealistic, in fact,
the fraction of collected biomass generally does not exceed 50%. Furthermore, in order to reduce the
As shown in Table 1, the total available biomass is enough to satisfy the biomass demand of the
volumes of biomass storage, the biomass input from extensive crops must be reasonably limited to
power plant, in the case of complete interception. However, this hypothesis is unrealistic, in fact, the
30% of the energy requirements of the power plant, due to the low calorific value and the low density
fraction of collected biomass generally does not exceed 50%. Furthermore, in order to reduce the
of straw bales that increase the costs for the collection, transport and storage.
volumes of biomass storage, the biomass input from extensive crops must be reasonably limited to
Table 2 shows the results of this first hypothesis: the available biomass from straw is abundant,
30% of the energy requirements of the power plant, due to the low calorific value and the low density
while the biomass from the pruning of olives and vineyards is not enough to cover the demand of the
of straw bales that increase the costs for the collection, transport and storage.
power plant.
Table 2 shows the results of this first hypothesis: the available biomass from straw is abundant,
while the biomass from the pruning of olives and vineyards is not enough to cover the demand of
Table 2. Available biomass in the territory of Trapani and biomass required by power plant.
the power plant.
Available Biomass
Biomass Demand
Surplus
Lower Heating Value
Figure 5 shows the distribution of several cultivations in the territory of Trapani. The map shows
Type of Cultivation
[MJ/kg] [t/Year] [t/Year] [t/Year]
also that the territory of Trapani is contained in a range of 30 km from the ATM (Azienda Trasporti
Extensive cultivation 14 17,318 4954 12,364
e Mobilità) bus depot, so this location can be a potential site for the installation of the biomass power
Vineyard pruning 17 6015
plant and hydrogen production. 9520 −2477
Olive pruning 17 1028
Table 2. Available biomass in the territory of Trapani and biomass required by power plant
Figure 5 shows the distribution of several cultivations in the territory of Trapani. The map shows
Lower Heating Value in a range of 30 km from the ATM (Azienda Trasporti e
also that the territory of Trapani is contained Available Biomass Biomass Demand Surplus
Type of Cultivation
[MJ/kg] [t/Year] [t/Year] [t/Year]
Extensive cultivation 14 17,318 4954 12,364
Vineyard pruning 17 6015
9520 −2477
Olive pruning 17 1028