
Page 13 - Jakubas_et_al._2014_Storm_Petrels
P. 13
82 D. Jakubas et al.
się dymorfizmem płciowym z większymi wy- niewielką sprawność zaproponowanej funkcji,
miarami u samic, a w przypadku długości głowy z zastrzeżenia do funkcji zaproponowanych przez
dziobem — z większymi wartościami u samców innych autorów (Tab. 4) jak i zmienność
(Tab. 3, Fig. 6). Najskuteczniejsza funkcja geograficzną rozmiarów ciała, do oznaczania płci
dyskryminacyjna do oznaczania płci prawidłowo u nawałnika burzowego zaleca się stosowanie
sklasyfikowała 75% osobników. Biorąc pod uwagę alternatywnych metod (np. molekularnych).
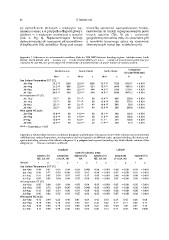
Appendix 1. Differences in environmental conditions (data for 1998–2007) between breeding regions: Mediterranean, South
Atlantic, North Atlantic. Med — median; Z, p — results of Mann-Whitney U test, n — number of measurement points (one per
colony for AT and WS, one per 0.5 degree for SST)*number of months*number of years* number of colonies studied.
Mediterranean South Atlantic North Atlantic Comparison
Med n Med n (Kruskal-Wallis test)
Med n
Hp
1280
Sea Surface Temperature SST (°C) 960
640
Jun–Sep 24.2 a,b 960 22.0 a,c 1088 13.4 d,c 7520 5433.7 < 0.001
22.0 a,c 824 13.4 d,c 5640 4091.5 < 0.001
Jun–Aug 24.2 a,b 80 22.5 a,c 544 14.2 d,c 3760 2739.1 < 0.001
60 22.5 a,c 808 14.0 d,c 5640 4076.3 < 0.001
Jul–Aug 24.9 a,b 40
60 22.1 b 80 13.4 a,d 480
Jul–Sep 24.6 a,b 22.1 b 60 13.6 a,d 360
80 23.1 b 40 14.4 a,d 240
Air temperature AT (°C) 60 23.1 b 40 13.9 a,d 360
40
Jun–Sep 23.2 a 60 14.9 a,c 80 18.1 d,c 480 359.9 < 0.001
14.9 a,c 60 17.8 d,c 360 270.5 < 0.001
Jun–Aug 23.7 a 15.8 a 20 17.1 d 240 < 0.001
15.2 a,c 20 17.9 d,c 360 59.9 < 0.001
Jul–Aug 25.1 a 269.8
Jul–Sep 23.5 a
Wind speed WS (m/s)
Jun–Sep 12.9 a,b 139.6 < 0.001
100.6 < 0.001
Jun–Aug 12.8 a,b 180.6 < 0.001
< 0.001
ul–Aug 12.9 a,b 97.0
Jul–Sep 12.9 a,b
a,b,c,d — Dunn test, p < 0.05
Appendix 2. Relationships between coordinates (longitude and latitude) of European Storm Petrels colonies and environmental
conditions (sea surface temperature, air temperature and wind speed) in at different scales: species (including all colonies), sub-
species (including colonies of the Atlantic subspecies H. p. pelagicus) and regional (including only North Atlantic colonies of this
subspecies). r — Pearson correlation coefficient.
Longitude Latitude
scale (N colonies), areas subspecies
(14) SA, NA
species (16) subspecies regional (12) species (16) rp regional (12)
ME, SA, NA (14) SA, NA NA
NA ME, SA, NA
rp
Variable rprp rprp
Sea Surface Temperature SST (°C) 0.04 -0.58 0.049 -0.95 < 0.001 -0.98 < 0.001 -0.93 < 0.001
Jun–Sep 0.04 0.87 -0.55 0.051 -0.53 0.07 -0.94 < 0.001 -0.97 < 0.001 -0.91 < 0.001
Jun–Aug 0.08 0.77 -0.53 0.07 -0.47 0.12 -0.93 < 0.001 -0.96 < 0.001 -0.88 < 0.001
Jul–Aug 0.11 0.67 -0.50 0.04 -0.55 0.06 -0.95 < 0.001 -0.97 < 0.001 -0.92 < 0.001
Jul–Sep 0.05 0.85 -0.54
0.04 -0.59 0.04 -0.95 < 0.001 -0.97 < 0.001 -0.93 < 0.001
Air temperature AT (°C) 0.047 -0.58 0.049 -0.94 < 0.001 -0.97 < 0.001 -0.92 < 0.001
Jun–Sep 0.05 0.84 -0.55 0.06 -0.51 0.09 -0.93 < 0.001 -0.96 < 0.001 -0.90 < 0.001
Jun–Aug 0.09 0.73 -0.54 0.04 -0.55 0.06 -0.95 < 0.001 -0.97 < 0.001 -0.92 < 0.001
Jul–Aug 0.12 0.65 -0.51
Jul–Sep 0.06 0.82 -0.55 0.40 0.61 0.04 0.42 0.10 0.24 0.42 0.56 0.06
0.62 0.54 0.07 0.32 0.22 0.11 0.71 0.48 0.11
Wind speed WS (m/s) 0.74 0.55 0.06 0.23 0.40 -0.00 1.00 0.47 0.12
Jun–Sep -0.12 0.64 0.25 0.40 0.63 0.03 0.40 0.13 0.21 0.47 0.58 0.048
Jun–Aug -0.19 0.48 0.15
Jul–Aug -0.20 0.45 0.10
Jul–Sep -0.11 0.68 0.25