
Page 8 - Jakubas_et_al._2014_Storm_Petrels
P. 8
Body size variation in the European Storm Petrel 77
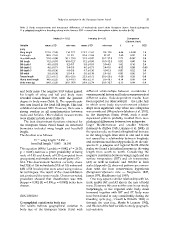
Table 3. Body measurements and intersexual differences of molecularly sexed adult European Storm Petrels (subspecies
H. p. pelagicus) caught in a breeding colony in the Faeroes. SSD — sexual size dimorphism relative to males (in %).
Males (n = 102) Females (n = 54) Comparison
(Student t test)
Variable mean ± SD min–max mean ± SD min–max
t p SSD
[mm]
Wing length 121.9 ± 2.43 114–127 123.7 ± 2.41 118–128 -4.46 < 0.001 -1.5
Tail length 56.5 ± 2.41 51–61 57.4 ± 2.04 52–62 -2.40 0.02 -1.6
Head-bill length 31.8 ± 0.66 30.1–33.5 31.5 ± 0.62 30.2–32.9 2.73 0.007 0.9
Bill length 11.2 ± 0.53 10.0–12.7 11.2 ± 0.55 10.3–12.5 0.52 0.60 0.4
Bill depth 1 4.0 ± 0.53 3.2–5.7 3.8 ± 0.61 3.5–4.9 1.42 0.16 3.4
Bill depth 2 4.6 ± 0.71 3.4–5.5 4.6 ± 0.71 3.4–5.5 -0.02 0.99 -0.05
Bill depth 3 4.8 ± 0.36 4.0–5.6 4.7 ± 0.36 4.0–5.3 0.65 0.52 0.8
Bill width 3.0 ± 0.30 2.5–4.9 3.0 ± 0.19 2.4–3.6 0.05 0.96 0.1
Tarsus length 22.2 ± 0.72 20.5–23.5 22.3 ± 0.72 20.5–23.5 -1.06 0.29 -0.6
Rump band length 14.5 ± 2.25 8.3–19.3 14.5 ± 2.11 9.5–18.7 -0.14 0.89 -0.4
Body mass [g] 24.5 ± 2.26 20.6–35.5 25.4 ± 2.74 20.8–32.7 -2.13 0.04 -3.6
and body mass. The negative SSD values gained different relationships between coordinates /
for length of wing and tail and body mass environmental factors and body measurements at
revealed female-biased SSD, with the greatest different scales. Scale-dependent results have
degree in body mass (Table 3). The opposite pat- been reported for other seabird — the Little Auk
tern was found in the head-bill length. This trait in which some body size-environment relation-
exhibited male-biased SSD. However, there was a ships were significant only when one subspecies
strong overlap in all morphometrics between was considered (Wojczulanis-Jakubas et al. 2011).
males and females. Other studied measurements In the European Storm Petrel, such a scale-
were similar in both sexes (Table 3). dependent pattern probably resulted from mor-
phological differences between two subspecies —
The best discriminant functions obtained for larger Mediterranean and smaller Atlantic
the European Storm Petrel based on structural (Hemery & d’Elbee 1985, Lalanne et al. 2001). At
biometrics included wing length and head-bill the species scale, we found a longitudinal increase
length. in the wing length from west to east and it was
The function is as follows: not caused by a relationship between longitude
and environmental data (Appendix 2). At the sub-
D = wing length * 0.356 – species H. p. pelagicus and regional North Atlantic
head-bill length * 0.865 – 16.196 scales, we found a latitudinal increase in the wing
length from south to north. Considering the
This equation (Wilks’ Lambda = 0.842, χ2 = 26.35, negative correlation between wing length and sea
p < 0.001) assumes a priori probability of being surface temperature (SST) and air temperature
male of 0.65 and female of 0.35 (computed from (AT) as well as latitude and SST/AT at both
group sizes) and results in the cut-off point of D = scales (Appendix 2), observed patterns are concor-
0.14. This discriminant function correctly classi- dant with the heat conservation hypothesis
fied 75% of 156 individuals (91% of 102 males and (Bergmann’s/James’s rule — Bergmann 1847,
44% of 54 females) that were sexed using molecu- James 1970, Blackburn et al. 1999).
lar techniques. The result of the cross-validation
test produced the same results. Chance-corrected One may expect a similar relationship with lat-
procedure showed that classification was 39% itude and/or SST and AT also in the case of body
(kappa = 0.392, SE = 0.096, p = 0.0002) better than mass. However, this was not the case in our study.
chance. Surprisingly, at the regional scale body mass
increased together with SST and AT. Body mass
DISCUSSION have been found to vary considerably during the
breeding cycle (e.g., Croxall & Ricketts 1983) or
Geographical variation in body size through the year (e.g., Marks & Leasure 1992),
Our results indicate geographical variation in and this is not the best variable to study geograph-
body size of the European Storm Petrel with ical variation.