
Page 6 - Jakubas_et_al._2014_Storm_Petrels
P. 6
Body size variation in the European Storm Petrel 75
70°N (Titus et al. 1984). We employed only data that met
the assumption of homogeneity of variance, nor-
mality and lack of multicollinearity in the func-
tion.
60°N RESULTS
50°N Geographical variation of body size
40°N Among both biometrical variables studied in both
sexes combined, only the wing length correlated
30°N significantly with coordinates. We found various
relationships at different scales. At the species and
20°W 10°W 0° 10°E 20°E subspecies scales, there was a positive relationship
with longitude indicating that wing length gener-
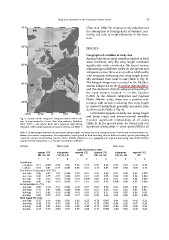
Fig. 2. Location of the compared European Storm Petrel colo- ally increased from west to east (Table 2, Fig. 3).
nies. A map created in Ocean Data View software (Schlitzer The longest wings were recorded in the Mediter-
2011). POR — site where birds were captured only during ranean subspecies on the Aegadian Islands (AEG),
migration. Other abbreviations and source of data: see Table 1. and the shortest in Atlantic subspecies breeding in
the most western location — on the Canaries
(CAN). At the Atlantic subspecies and regional
North Atlantic scales, there was a positive rela-
tionship with latitude indicating that wing length
in unsexed individuals generally increased from
south to north (Table 2, Fig. 4).
Correlation analysis on body size (wing length
and body mass) and environmental variables
revealed significant relationships at all scales
(Table 2). At the species scale, we found only one
significant relationship — wind speed (WS) in all
Table 2. Relationships between measurements (wing length and body mass) of European Storm Petrels and environmental con-
ditions (sea surface temperature, air temperature, wind speed) in their breeding sites at different scales: species (including all
colonies), subspecies (including colonies of the Atlantic subspecies H. p. pelagicus) and regional (including only North Atlantic
colonies of this subspecies). r — Pearson correlation coefficient.
Variable Wing length Body mass
scale (N colonies), areas
species (16) subspecies regional (12) species (13) subspecies regional (10)
ME, SA, NA (14) SA, NA (12) SA, NA NA
NA ME, SA, NA
rp rp
rprp rprp
Coordinates 0.03 0.38 0.23 0.26 0.40 0.07 0.82 -0.32 0.38
Longitude 0.71 0.002 0.58 0.001 0.68 0.01 -0.13 0.67 0.02 0.94 -0.55 0.10
Latitude 0.18 0.51 0.77
0.004 -0.70 0.01 0.26 0.40 0.02 0.95 0.63 0.052
Sea Surface Temperature SST (°C) 0.004 -0.70 0.01 0.28 0.35 0.04 0.90 0.64 0.048
Jun–Sep 0.06 0.82 -0.72 0.004 -0.72 0.009 0.28 0.36 0.03 0.93 0.64 0.046
Jun–Aug 0.08 0.75 -0.71 0.003 -0.71 0.01 0.24 0.32 0.006 0.98 0.63 0.052
Jul–Aug 1.00 0.72 -0.72
Jul–Sep 0.06 0.83 -0.73 0.004 -0.70 0.01 0.28 0.36 0.05 0.89 0.63 0.054
0.006 -0.69 0.01 0.31 0.30 0.07 0.83 0.64 0.047
Air temperature AT (°C) 0.006 -0.70 0.01 0.33 0.27 0.08 0.81 0.66 0.04
Jun–Sep 0.08 0.78 -0.71 0.004 -0.71 0.01 0.28 0.36 0.04 0.89 0.63 0.049
Jun–Aug 0.11 0.67 -0.69
Jul–Aug 0.13 0.62 -0.70 0.84 0.36 0.25 -0.70 0.007 -0.64 0.03 -0.42 0.23
Jul–Sep 0.08 0.78 -0.72 0.60 0.32 0.31 -0.70 0.007 -0.64 0.02 -0.37 0.29
0.40 0.29 0.36 -0.71 0.007 -0.66 0.02 -0.36 0.30
Wind speed WS (m/s) 0.76 0.35 0.26 -0.71 0.006 -0.65 0.02 -0.43 0.22
Jun–Sep -0.37 0.16 -0.06
Jun–Aug -0.43 0.10 -0.15
Jul–Aug -0.46 0.07 -0.24
Jul–Sep -0.37 0.15 -0.09