
Page 12 - Lovison_alii_2010
P. 12
MODELING POSIDONIA OCEANICA GROWTH DATA
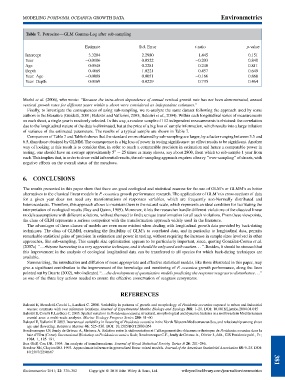
Table 7. Petrosino—GLM Gamma-Log after sub-sampling
Estimate Std. Error t-ratio p-value
Intercept 3.3204 2.2980 1.445 0.151
Year 0.0106 0.0522 0.203 0.840
Age 0.0548 0.2281 0.240 0.811
Depth 0.4669 1.0221 0.457 0.649
Year: Age 0.0008 0.0051 0.166 0.868
Year: Depth 0.0169 0.0229 0.735 0.464
Marba ´ et al. (2006), who wrote: ‘‘Because the intra-shoot dependence of annual vertical growth rate has not been demonstrated, annual
vertical growth rates for different years within a shoot were considered as independent estimates.’’
Finally, to investigate the consequences of using sub-sampling, we re-analyze the same dataset following the approach used by some
authors in the literature (Guidetti, 2001; Balestri and Vallerini, 2003; Balestri et al., 2004). Within each longitudinal series of measurements
on each shoot, a single year is randomly selected. In this way, a random sample of 112 independent measurements is obtained: the correlation
due to the longitudinal nature of the data is eliminated, but at the price of a big loss of sample information, which results into a large inflation
of variance of the estimated parameters. The results of a typical sample are shown in Table 7.
Comparison of Table 7 and Table 6 shows that the standard errors obtained by sub-sampling are larger, by a factor ranging between 3.5 and
6.5, than those obtained by GLMM. The consequence is a big loss of power in testing significance: no effect results to be significant. Another
way of looking at this result is to consider that, in order to reach a comparable precision in estimation and hence a comparable power in
2
testing, one should have on average approximately 5 ¼ 25 times as many shoots, say about 2800, from which to sub-sample 1 year from
each. This implies that, in order to draw valid inferential results, the sub-sampling approach requires a heavy ‘‘over-sampling’’ of shoots, with
negative effects on the overall status of the meadows.
6. CONCLUSIONS
The results presented in this paper show that there are good ecological and statistical reasons for the use of GLM’s or GLMM’s as better
alternatives to the classical linear models in P. oceanica growth performance research. The applications of GLM’s to cross-sections of data
for a given year does not need any transformations of responses variables, which are frequently non-Normally distributed and
heteroscedastic. Therefore, this approach allows to maintain them in the natural scale, which represents an ideal condition for facilitating the
interpretation of ecological results (Day and Quinn, 1989). Moreover, it lets the researcher handle different violations of the classical linear
models assumptions with different solutions, without the need to find a unique transformation for all such violations. From these viewpoints,
the class of GLM represents a serious competitor with the transformation approach widely used in the literature.
The advantages of these classes of models are even more evident when dealing with longitudinal growth data provided by back-dating
techniques. The class of GLMM, extending the flexibility of GLM’s to correlated data, and in particular to longitudinal data, permits
remarkable statistical gains of precision in estimation and power in testing, without requiring the increase in sample sizes involved in other
approaches, like sub-sampling. This sample size optimization appears to be particularly important, since, quoting Gonza ´lez-Correa et al.
(2007a) ‘‘...rhizome harvesting is a very aggressive technique, and it should be only used with caution...’’. Besides, it should be stressed that
this improvement in the analysis of ecological longitudinal data can be transferred to all species for which back-dating techniques are
available.
Summarizing, the introduction and diffusion of more appropriate and effective statistical models, like those illustrated in this paper, may
give a significant contribution to the improvement of the knowledge and monitoring of P. oceanica growth performance, along the lines
pointed out by Duarte (2002), who indicated ‘‘.. .the development of quantitative models predicting the response seagrass to disturbance...’’
as one of the three key actions needed to ensure the effective conservation of seagrass ecosystems.
REFERENCES
Balestri E, Benedetti-Cecchi L, Lardicci C. 2004. Variability in patterns of growth and morphology of Posidonia oceanica exposed to urban and industrial
wastes: contrasts with two reference locations. Journal of Experimental Marine Biology and Ecology 308: 1–21. DOI: 10.1016/j.jembe.2004.01.015
Balestri E, Cinelli F, Lardicci C. 2003. Spatial variation in Posidonia oceanica structural, morphological and dynamic features in a northwestern Mediterranean
coastal area: a multi-scale analysis. Marine Ecology Progress Series 250: 51–60.
Balestri E, Vallerini F. 2003. Interannual variability in flowering of Posidonia oceanica in the North-Western Mediterranean Sea, and relationship among shoot
age and flowering. Botanica Marina 46: 525–530. DOI: 10.1515/BOT.2003.054
Boudouresque CF, Jeudy de Grissac A, Meinesz A. Relation entre la se `dimentation et l’allongement des rhizomes orthotropes de Posidonia oceanica dans la
baie d’Elbu (Corse). International Workshop on Posidonia oceanica Beds, Boudouresque C.F., Jeudy de Grissac A., Olivier J., e ´dit., GIS Posidonie publ., Fr.;
1984. 1, 185–191.
Box GEP, Cox DR. 1964. An analysis of transformations. Journal of Royal Statistical Society, Series B 26: 211–246.
Breslow NE, Clayton DG. 1993. Approximate inference in generalized linear mixed models. Journal of the American Statisticial Association 88: 9–25. DOI:
10.2307/2290687 381
Environmetrics 2011; 22: 370–382 Copyright ß 2010 John Wiley & Sons, Ltd. wileyonlinelibrary.com/journal/environmetrics