
Page 8 - Lovison_alii_2010
P. 8
MODELING POSIDONIA OCEANICA GROWTH DATA
carried out such exploration not on the raw data, but on the standardized residuals from a classical linear regression model on Age, since the
assumption of the model refers to the conditional distribution of the response, given the relevant predictor.
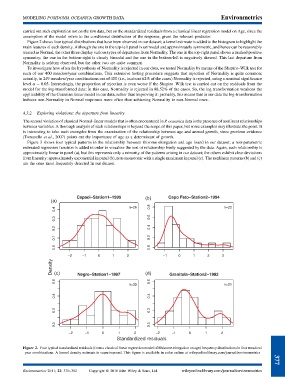
Figure 2 shows four typical distributions that have been observed in our dataset; a kernel estimate is added to the histogram to highlight the
main features of each density. Although the one in the top-left panel is unimodal and approximately symmetric, and hence can be reasonably
treated as Normal, the other three display various types of departures from Normality. The one in the top-right panel shows a marked positive
symmetry; the one in the bottom-right is clearly bimodal and the one in the bottom-left is negatively skewed. This last departure from
Normality is seldom observed, but the other two are quite common.
To investigate how often the hypothesis of Normality is rejected in our data, we tested Normality by means of the Shapiro–Wilk test for
each of our 400 meadow/year combinations. This extensive testing procedure suggests that rejection of Normality is quite common;
actually, in 249 meadow/year combinations out of 400 (i.e., in about 62% of the cases) Normality is rejected, using a nominal significance
level a ¼ 0:05. Interestingly, the proportion of rejection is even worse if the Shapiro–Wilk test is carried out on the residuals from the
model for the log-transformed data: in this case, Normality is rejected in 88.52% of the cases. So, the log transformation weakens the
applicability of the Gaussian linear model in our data, rather than improving it: probably, this means that in our data the log-transformation
induces non-Normality in Normal responses more often than achieving Normality in non-Normal ones.
4.3.2. Exploring violations: the departure from linearity
The second violation of classical Normal-linear models that is often encountered in P. oceanica data is the presence of nonlinear relationships
between variables. A thorough analysis of such relationships is beyond the scope of this paper, but some examples may illustrate the point. It
is interesting to take such examples from the examination of the relationship between age and annual growth, since previous evidence
(Tomasello et al., 2007) points out the importance of age as a determinant of growth.
Figure 3 shows four typical patterns in the relationship between rhizome elongation and age found in our dataset; a non-parametric
estimated regression function is added in order to visualize the sort of relationship freely suggested by the data. Again, such relationship is
approximately linear in panel (a), but this represents only a minority of the patterns arising in our dataset; the others exhibit clear deviations
from linearity: approximately exponential in panel (b), non-monotonic with a single maximum in panel (c). The nonlinear patterns (b) and (c)
are the ones most frequently detected in our dataset.
Capaci−Station1−1995 (b) Capo Feto−Station2−1994
(a)
0.4 n=26 0.8 n=22
0.3 0.6
0.2 0.4
0.1 0.2
0.0 0.0
−2 −1 0 1 2 −1 0 1 2 3
Density (c) Negro−Station1−1997 (d) Granitola−Station2−1992
0.6 0.6
n=30 n=21
0.4 0.4
0.2 0.2
0.0 0.0
−2 −1 0 1 2 −2 −1 0 1 2
Standardized residuals
Figure 2. Four typical standardized residuals (from a classical linear regression model of Rhizome elongation on age) frequency distributions in four meadow/
year combinations. A kernel density estimate is superimposed. This figure is available in color online at wileyonlinelibrary.com/journal/environmetrics 377
Environmetrics 2011; 22: 370–382 Copyright ß 2010 John Wiley & Sons, Ltd. wileyonlinelibrary.com/journal/environmetrics