
Page 9 - Lovison_alii_2010
P. 9
G. LOVISON ET AL.
(a) Capo Feto−Station1−1995 (b) Favignana−Station1−1991
0
20
n=31
15 n=25
15
10
10
2
5
Rhizome elongation (mm/year)
0 5 10 15 20 25 30 2 4 6 8 10 12 14
(c) Bonagia−Station1−1997
5
n=50
10
5
1
5 10 15 20
Rhizome age
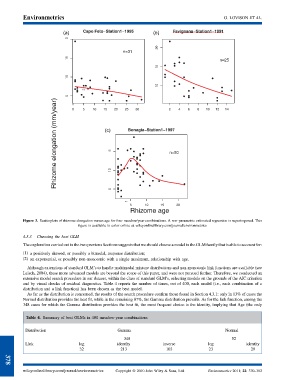
Figure 3. Scatterplots of rhizome elongation versus age for four meadow/year combinations. A non-parametric estimated regression is superimposed. This
figure is available in color online at wileyonlinelibrary.com/journal/environmetrics
4.3.3. Choosing the best GLM
The exploration carried out in the two previous Sections suggests that we should choose a model in the GLM family that is able to account for:
(1) a positively skewed, or possibly a bimodal, response distribution;
(2) an exponential, or possibly non-monotonic with a single maximum, relationship with age.
Although extensions of standard GLM’s to handle multimodal mixture distributions and non-monotonic link functions are available (see
Leisch, 2004), these more advanced models are beyond the scope of this paper, and were not pursued further. Therefore, we conducted an
extensive model search procedure in our dataset, within the class of standard GLM’s, selecting models on the grounds of the AIC criterion
and by visual checks of residual diagnostics. Table 4 reports the number of times, out of 400, each model (i.e., each combination of a
distribution and a link function) has been chosen as the best model.
As far as the distribution is concerned, the results of the search procedure confirm those found in Section 4.3.1: only in 13% of cases the
Normal distribution provides the best fit, while in the remaining 87%, the Gamma distribution prevails. As for the link function, among the
348 cases for which the Gamma distribution provides the best fit, the most frequent choice is the identity, implying that Age (the only
Table 4. Summary of best GLMs in 400 meadow-year combinations
Distribution Gamma Normal
348 52
Link log identity inverse log identity
32 213 103 23 29
378
wileyonlinelibrary.com/journal/environmetrics Copyright ß 2010 John Wiley & Sons, Ltd. Environmetrics 2011; 22: 370–382