
Page 5 - Montesanto_etal-2014
P. 5
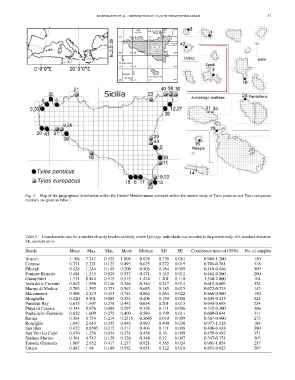
MONTESANTO ET AL.: DISTRIBUTION OF TYLOS IN THE MEDITERRANEAN          51

Fig. 2. Map of the geographical distribution within the Central Mediterranean surveyed within the current study of Tylos ponticus and Tylos europaeus;
numbers are given in Table 1.

Table 2. Granulometric data for a number of sandy beaches in Sicily, where Tylos spp. individuals was recorded in the present study. SD, standard deviation;
SE, standard error.

Beach                 Mean    Max.   Min.   Mode    Median   SD     SE    Confidence interval (95%)  No. of samples

Brucoli               1.108  7.247   0.525  1.008   0.976   0.738  0.061          0.989-1.200             150
Cornino               0.731  2.221   0.122  0.493   0.675   0.272  0.015          0.701-0.761             318
Filicudi              0.428  1.244   0.145  0.206   0.403   0.164  0.009          0.410-0.446             309
Fontane Bianche       0.484  1.315   0.025  0.333   0.471   0.163  0.012          0.462-0.500             200
Giampilieri           1.771  8.444   0.515  0.515   1.474   1.201  0.118          1.540-2.000             104
Isola delle Correnti  0.642  1.956   0.146  0.346   0.346   0.247  0.014          0.615-0.669             324
Marina di Modica      0.703  1.592   0.331  0.563   0.685   0.185  0.015          0.672-0.733             143
Marzamemi             0.908  2.219   0.453  0.744   0.862   0.264  0.022          0.866-0.900             150
Morghella             0.420  0.901   0.005  0.354   0.406   0.139  0.008          0.405-0.435             323
Paradise Bay          0.673  1.697   0.278  0.442   0.634   0.201  0.013          0.648-0.698             254
Playa di Catania      0.344  0.876   0.008  0.297   0.338   0.111  0.006          0.332-0.300             306
Punta delle Formiche  0.622  1.609   0.272  0.409   0.589   0.199  0.011          0.600-0.644             311
Ramla                 0.384  0.754   0.214  0.2515  0.3645  0.010  0.009          0.367-0.400             273
Ronciglio             1.047  2.643   0.335  0.846   0.983   0.490  0.036          0.977-1.118             184
San Blas              0.422  0.8505  0.212  0.317   0.403   0.111  0.008          0.406-0.438             380
San Vito Lo Capo      0.476  1.258   0.034  0.274   0.454   0.16   0.009          0.459-0.492             351
Sindaro Marino        0.361  0.742   0.129  0.326   0.348   0.12   0.007          0.347-0.374             303
Torretta Granitola    1.007  2.652   0.417  1.277   0.921   0.365  0.024          0.961-1.054             237
Ustica                0.887  1.94    0.189  0.592   0.851   0.322  0.018          0.851-0.923             307